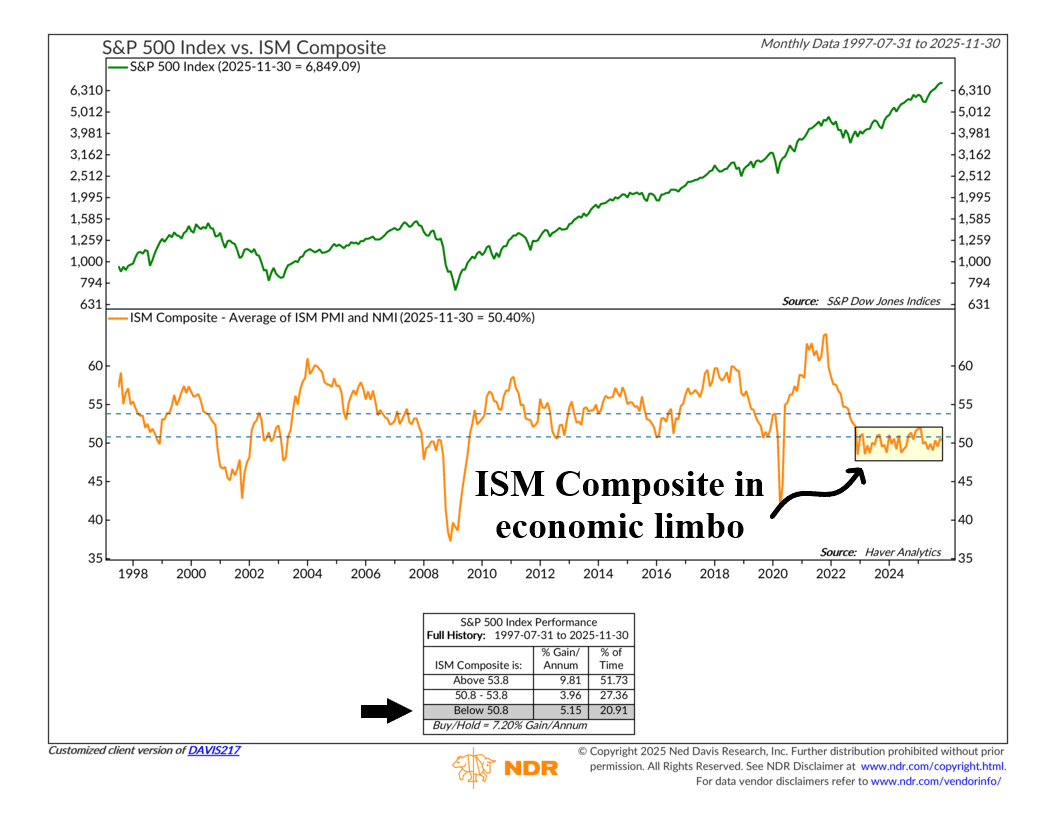
Every month the Institute for Supply Management releases two surveys that describe the state of the U.S. economy. One measures manufacturing activity and the other measures services. Average them together and you get what we call the ISM Composite Index, shown as the orange line on the chart above.
This is important because it gives us a single, broad measure of economic momentum. When the reading sits well above 50, it signals expansion. When it falls below 50, it signals contraction. And as the performance box at the bottom shows, expansions tend to coincide with stronger S&P 500 returns, while contractions line up with weaker ones.
I bring this up for two reasons. First, last month’s release marked the ninth straight month the composite has been below 50, which puts it in contraction territory. But what’s weirder—my second point—is that it’s spent the past three years or so stuck right around or right below 50.
This is rare. The ISM Composite usually rebounds quickly after a slowdown or breaks sharply lower during recessions. In other words, it tends to move decisively in one direction—not sideways. But it’s not doing that right now. It’s kind of stuck in low-neutral—moving sideways. One might even call it economic limbo.
Is this bad? Well, on the one hand, it’s not the best environment for stock returns. As you can see, ISM Composite readings above 53.8 have historically been the sweet spot for the S&P 500, averaging nearly 10 percent per year. But it’s also technically not the worst environment for returns either. Hovering just below 50.8 like this, returns have averaged over 5 percent, which is slightly better than the sub-4 percent performance seen in the neutral 50.8 to 53.8 range.
So what does this mean? Well, I think the best interpretation is to say, sure, the manufacturing and services sides of the economy have stopped growing and are stuck in a mild contractionary state, but at least it hasn’t completely fallen off the hinges like in past recessionary periods. The economy is stable, albeit weak—and that has been good enough to sustain the ongoing 3-year rally in stock prices.
So, the key going forward is whether activity improves from here or slips into a more meaningful decline, as that could alter the calculus for the stock market.
This is intended for informational purposes only and should not be used as the primary basis for an investment decision. Consult an advisor for your personal situation.
Indices mentioned are unmanaged, do not incur fees, and cannot be invested into directly.
Past performance does not guarantee future results.
The S&P 500 Index, or Standard & Poor’s 500 Index, is a market-capitalization-weighted index of 500 leading publicly traded companies in the U.S.