When you want to know if the stock market is expensive, the obvious move is to look at the price-to-earnings ratio. You know, the so-called P/E Ratio. Divide today’s price by today’s earnings, and you’ve got a number.
Simple enough. But there’s a problem: earnings can swing wildly from year to year depending on the economic cycle. A single bad year makes the market look expensive. A boom year can make it look cheap.
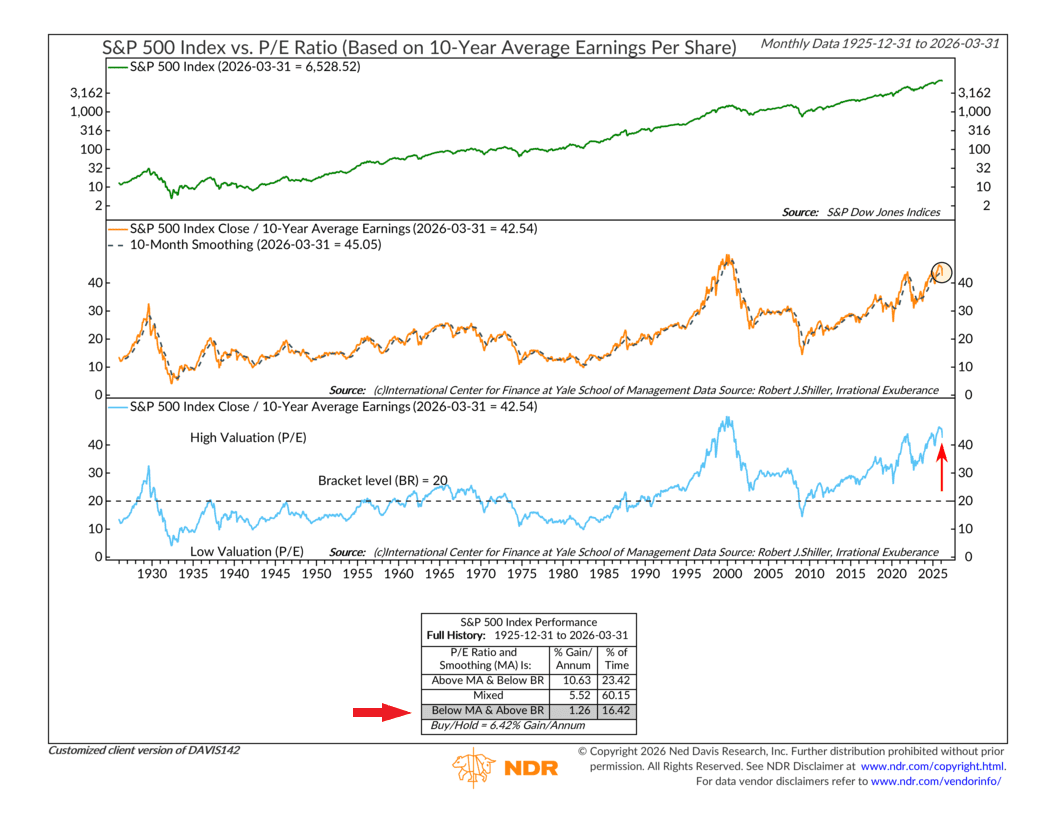
That’s exactly the problem this week’s indicator was designed to solve. Rather than using just one year of earnings, it divides the S&P 500 price by the average of the past ten years of earnings per share — a method popularized by Yale economist Robert Shiller. Smoothing out a full decade of the earnings cycle gives you a much steadier yardstick for valuation. The result is what you might hear called the CAPE ratio, and it has one of the longer track records in financial research, going all the way back to 1925.
The chart is organized in three panels. The top shows your standard S&P 500 stock index on a log scale. The middle panel plots the CAPE ratio itself as an orange line, with a 10-month smoothing average running alongside it as a dashed line — that smoothing helps reduce the short-term choppiness in the ratio and makes the trend easier to read. The bottom panel shows the same CAPE, but this time with a horizontal dashed line drawn at a level of 20, labeled the “bracket level.” Below 20 is historically normal territory. Above it? That’s considered high valuation territory, i.e., expensive.
Now, the key to this is indicator is how it analyses the combination of these two CAPE ratios. When the CAPE is below that bracket level of 20 and above its smoothing average — cheap and improving — the S&P has returned about 10.6 percent per year going back a century. The mixed middle scenario produces around 5.5 percent. And the worst outcome is when the CAPE is both above the bracket level of 20 and below its smoothing average — expensive and rolling over. That combination has historically produced just 1.3 percent per year. The buy-and-hold return over the full period is 6.4 percent, so the gap is hard to ignore.
So where are we today?
Well, the CAPE currently sits at 42.54 — levels only seen during the late 1990s dot-com bubble and the post-Covid bull market. Oh, and it has recently slipped below its 10-month smoothing average of 45.05. In other words, it’s expensive and rolling over.
That puts us in the historically weakest zone, where returns have averaged just 1.3 percent per year. And to be fair, the market’s recent selloff wasn’t exactly surprising given that backdrop.
But here’s where it gets complicated. The CAPE is a long-horizon tool — it speaks to the next decade more than the next month — and as of today, markets appear to be bouncing back sharply and look to close near all-time highs. Short-term momentum and long-term valuation don’t always agree, and right now they’re clearly having an argument.
So what the CAPE is really telling you isn’t “sell tomorrow” — it’s more like a warning label on the jar. The ingredients are more expensive than they’ve almost ever been, and history suggests that limits the upside from here. Whether the recent dip was the market’s way of acknowledging that, or just a speed bump on the way higher, is still very much an open question.
This is intended for informational purposes only and should not be used as the primary basis for an investment decision. Consult an advisor for your personal situation.
Indices mentioned are unmanaged, do not incur fees, and cannot be invested into directly.
Past performance does not guarantee future results.
The S&P 500 Index, or Standard & Poor’s 500 Index, is a market-capitalization-weighted index of 500 leading publicly traded companies in the U.S.