
One great player can carry a team for a game. Maybe even a whole season. But the teams that win championships tend to have everybody contributing—and the same is true in the stock market. A narrow rally, where just a few giant stocks are doing the heavy lifting, is a very different thing from one where the whole market is moving together.
This week’s indicator is designed around that concept. It’s called a breadth thrust indicator, and it’s based on the NDR Multi-Cap Institutional Equal-Dollar-Weighted Equity Series—a broad market index where every stock, large or small, carries the same weight. That’s important, because weighting every stock equally prevents a few giants from distorting the picture. When this index surges, it means the rally is genuinely widespread.
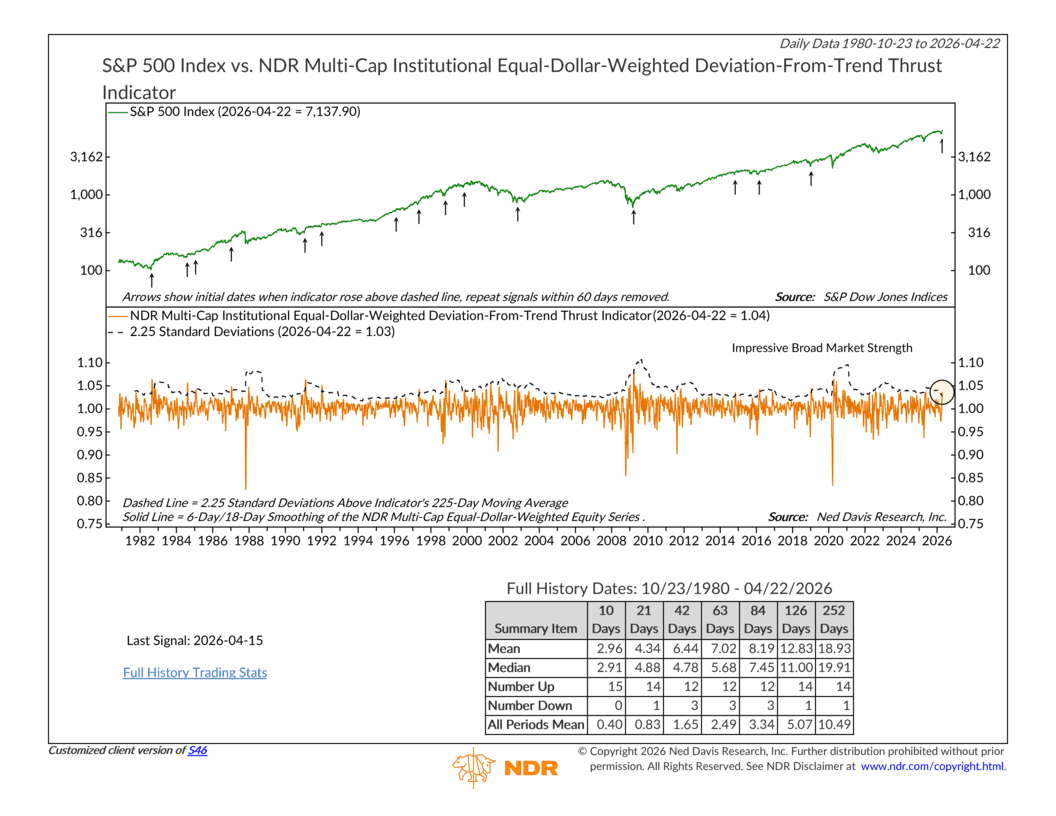
The bottom panel of the chart, shown above, plots a deviation-from-trend measure—specifically, the ratio of a short-term (6-day) moving average of that equal-weighted series to a longer-term (18-day) moving average. Think of it as a way to measure how much the market’s short-term momentum is surging relative to its own recent pace. When that ratio spikes sharply upward, it’s a sign that broad-based buying has taken hold in a meaningful way.
The dashed line in the bottom panel is the trigger. It sits 2.25 standard deviations above the indicator’s own 225-day moving average. That’s a high bar—and importantly, it adjusts over time based on recent market volatility, so it’s always measuring momentum relative to recent history rather than some fixed absolute level. When the solid orange line crosses above the dashed line, we get a thrust. The arrows on the top panel mark every instance going back to 1980.
So where are we today?
Well, the signal fired on April 15th. After weeks of market turbulence and a sharp pullback, stocks came roaring back—and the breadth of that recovery was powerful enough to push the indicator above its trigger level. The equal-weighted series surged, and the short-term moving average leapt above the long-term with enough force to clear the 2.25 standard deviation threshold.
What has that meant historically? Well, going back to 1980, there have been 15 prior signals. In the 10 trading days following a signal, the S&P 500 has been positive every single time—15 for 15—with an average (mean) gain of 2.96%, compared to just 0.40% for all comparable 10-day periods. Stretch the window out to a full year (252 trading days), and the average gain after a signal has been 18.93%, versus 10.49% for all periods. Only one of those 15 signals ever resulted in a negative one-year return!
The bottom line: this is a rare signal, and it has a historically impressive track record. When the broad market—every stock, not just the biggest ones—surges in unison with enough force to clear a high, volatility-adjusted threshold, history says it’s worth paying attention. This one goes in the bullish column.
This is intended for informational purposes only and should not be used as the primary basis for an investment decision. Consult an advisor for your personal situation.
Indices mentioned are unmanaged, do not incur fees, and cannot be invested into directly.
Past performance does not guarantee future results.
The S&P 500 Index, or Standard & Poor’s 500 Index, is a market-capitalization-weighted index of 500 leading publicly traded companies in the U.S.