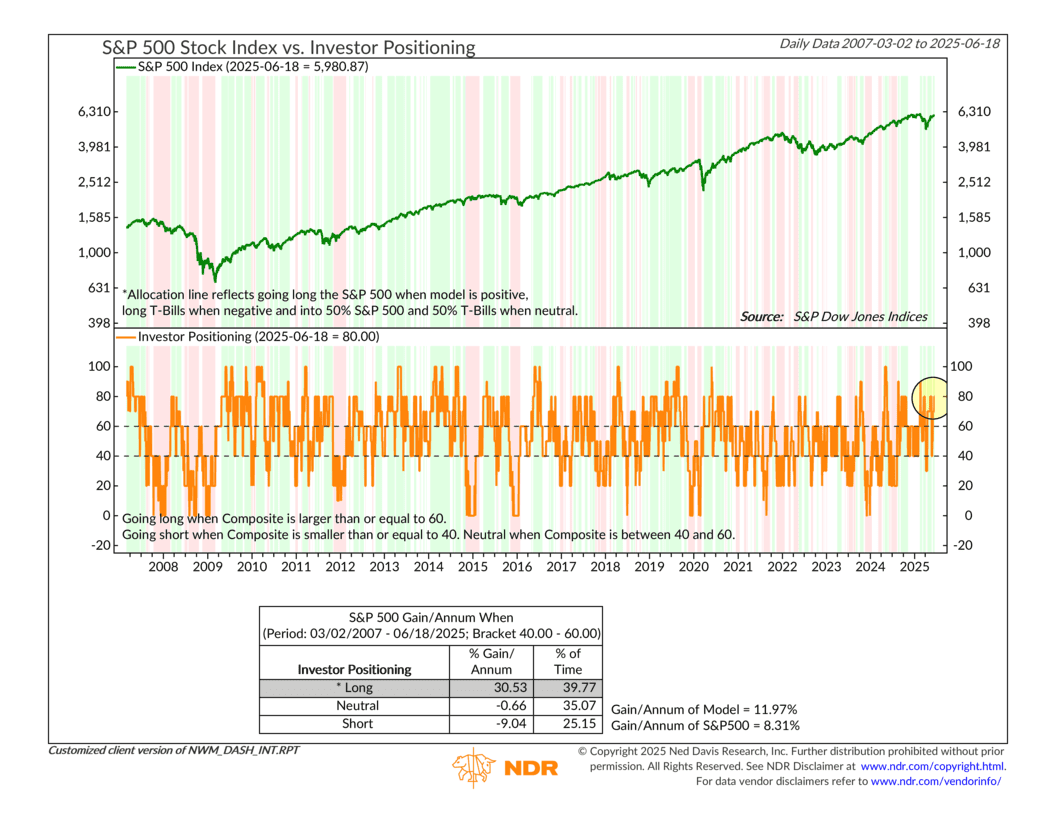
A lot of the time, when we talk about sentiment and contrarianism in the stock market, we’re referring to surveys, polls, stuff like that. But another area we like to look at is how people are actually allocating their money. To use the industry jargon: how are they positioned?
That’s what this week’s indicator seeks to answer. Actually, it’s not a single indicator but a composite of five separate indicators, all of which track how investors are positioning their investments. Some look at flows into inverse ETFs—meaning investors are trying to profit from stock declines—while others focus on pure equity fund flows. A few also track things like margin debt and the put/call ratio.
But all five indicators measure investor positioning through a contrarian lens. When investors are “all in” on stocks, it produces a “sell” signal for our purposes. When they’re backing away from stocks, it produces a “buy” signal.
Add up the signals, and we get a composite score, shown as the orange line in the bottom clip of the chart. When that score is above 60, it’s historically been a bullish environment for stocks. The S&P 500 (green line, top clip) has climbed at an average annualized rate of more than 30% in those periods. But when the score drops below 40, the S&P has delivered negative returns—about -9% annualized, to be exact.
Where are we now? Well, as you can see, the composite score is currently at 80. That means 80% (4 out of 5) of the indicators are flashing positive signals. That’s pretty bullish. It’s basically telling us that, based on what investors are actually doing with their money, they don’t fully trust the recent rally in the stock market.
To be fair, that’s understandable—but the historical record suggests they’re likely wrong. When the majority is cautious, it often creates the right conditions for a sustained rally.
Bottom line? This composite of indicators is a great example of how we model risk. We take a handful of individual signals and combine them to give us a “weight of the evidence” reading. That then becomes a key component of our overall model. And right now, it’s one of the most positive components we’ve got, signaling a decent environment for owning risk.
This is intended for informational purposes only and should not be used as the primary basis for an investment decision. Consult an advisor for your personal situation.
Indices mentioned are unmanaged, do not incur fees, and cannot be invested into directly.
Past performance does not guarantee future results.
The S&P 500 Index, or Standard & Poor’s 500 Index, is a market-capitalization-weighted index of 500 leading publicly traded companies in the U.S.