
For most of this year, the stock market hadn’t been very choosy. Money flowed into pretty much just about everything. Companies with shaky balance sheets did just as well as the steady ones—sometimes even better.
But that has changed over the past couple of weeks. The tech-heavy Nasdaq has started to struggle, recently notching its worst week since April 2025. Some lenders are starting to charge the big AI builders more to borrow, while the stocks that are holding up best are the bigger, more traditionally profitable ones.
In other words, the market has gotten picky.
So, for this week, let’s look at an indicator built to measure this sort of dynamic.
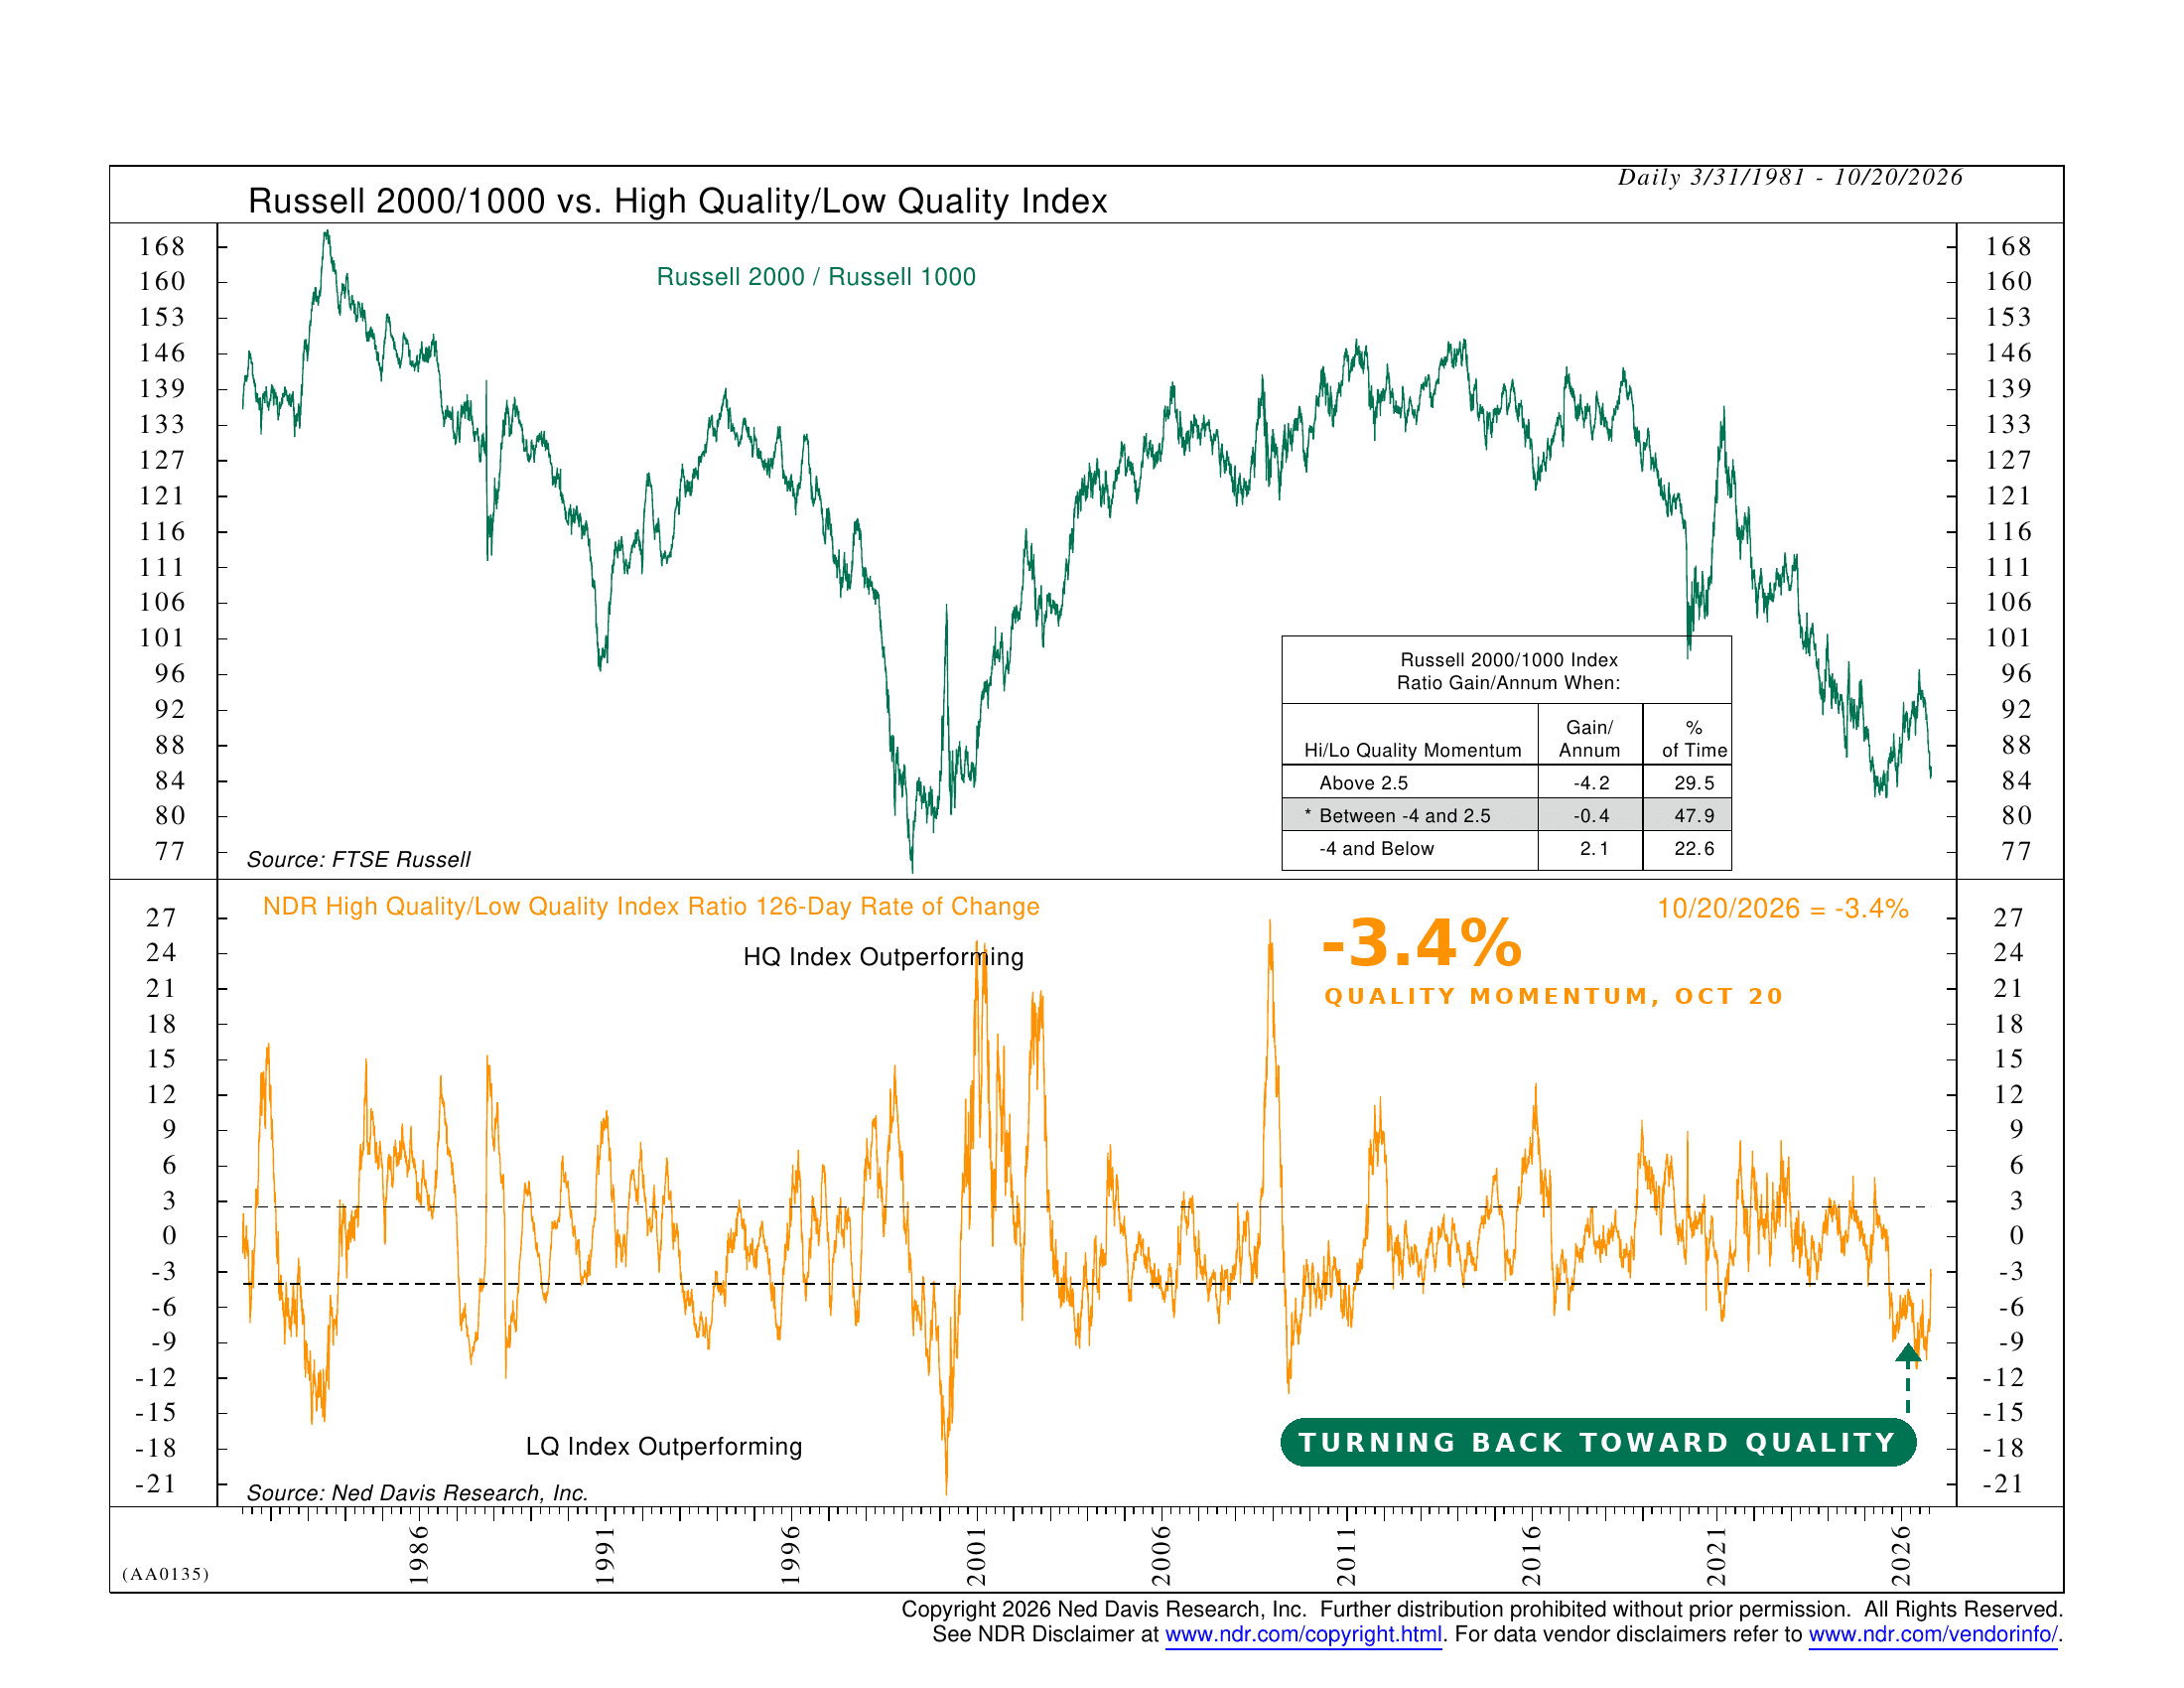
Here’s how it works. Take the stocks with the steadiest records of earnings and dividends and put them in one basket. Call it high quality. Take the ones with the shakiest records and put them in another. Call it low quality. Then compare how the two baskets have performed over the past six months. That is the orange line in the bottom panel of the chart. When it is above the top dashed line at 2.5, quality is winning. When it is below the lower dashed line at -4, the junk (low quality) is winning.
The top panel shows something related: the Russell 2000 small-cap index divided by the Russell 1000 large-cap index. When that line falls, small companies are losing ground to big ones.
Why pair the two? Because small companies are, as a group, lower quality. They carry more debt, earn thinner profits, and feel higher interest rates first. So when investors get picky about quality, small caps tend to lose.
History bears this out. Since 1981, when the quality line has been above 2.5, small caps have lost about 4.2% per year relative to large caps. That has been the case about 30% of the time. In the middle zone, they have roughly broken even. And when the junk has been winning, below -4, small caps have gained about 2.1% per year on large caps.
So where are we now? For much of 2026, the reading sat deep in negative territory. Low quality was beating high quality by a wide margin, which is typical of a market that isn’t asking many questions. Then came October. As of October 20, the line has snapped back to -3.4%, a sharp swing toward quality in just a few weeks.
The small-cap line tells the same story. It has dropped to levels last seen in the early 2000s. Big, profitable companies are holding up. The smaller and shakier ones are not.
Now, a word of caution. A reading of -3.4% is still in the middle zone. The market has turned pickier, but it has not yet made a full flight to quality. And these swings can reverse. A big relief rally, like the one in late 2020, can send money right back into the riskiest names.
Still, the direction of travel matters. A market that stops rewarding everything equally is a market that is paying closer attention to risk. That usually shows up in indicators like this one before it shows up in the headlines.
The bottom line? When the tide is rising, quality doesn’t matter much. But when the tide starts to go out, it matters a lot more. The past few weeks suggest investors have begun sorting winners from losers again. That fits with the more cautious tone we have been describing in this space, and it is definitely a shift worth watching closely.
This is intended for informational purposes only and should not be used as the primary basis for an investment decision. Consult an advisor for your personal situation.
Indices mentioned are unmanaged, do not incur fees, and cannot be invested into directly.
Past performance does not guarantee future results.
The Russell 2000 Index is a market-capitalization-weighted index of approximately 2,000 small-cap U.S. companies, representing the smallest companies in the Russell 3000 Index.
The Russell 1000 Index is a market-capitalization-weighted index of approximately 1,000 of the largest publicly traded U.S. companies.
The High Quality/Low Quality Index compares the performance of a basket of U.S. stocks with the highest earnings and dividend quality rankings to a basket with the lowest.