Earnings are an important driver of stock market returns.
But the stock market is a complicated beast—it doesn’t just trade off earnings growth alone.
The key insight of this week’s featured indicator is that the market trades off the change in the earnings growth rate. In other words, it’s earnings growth acceleration (or deceleration) that matters for stock market returns.
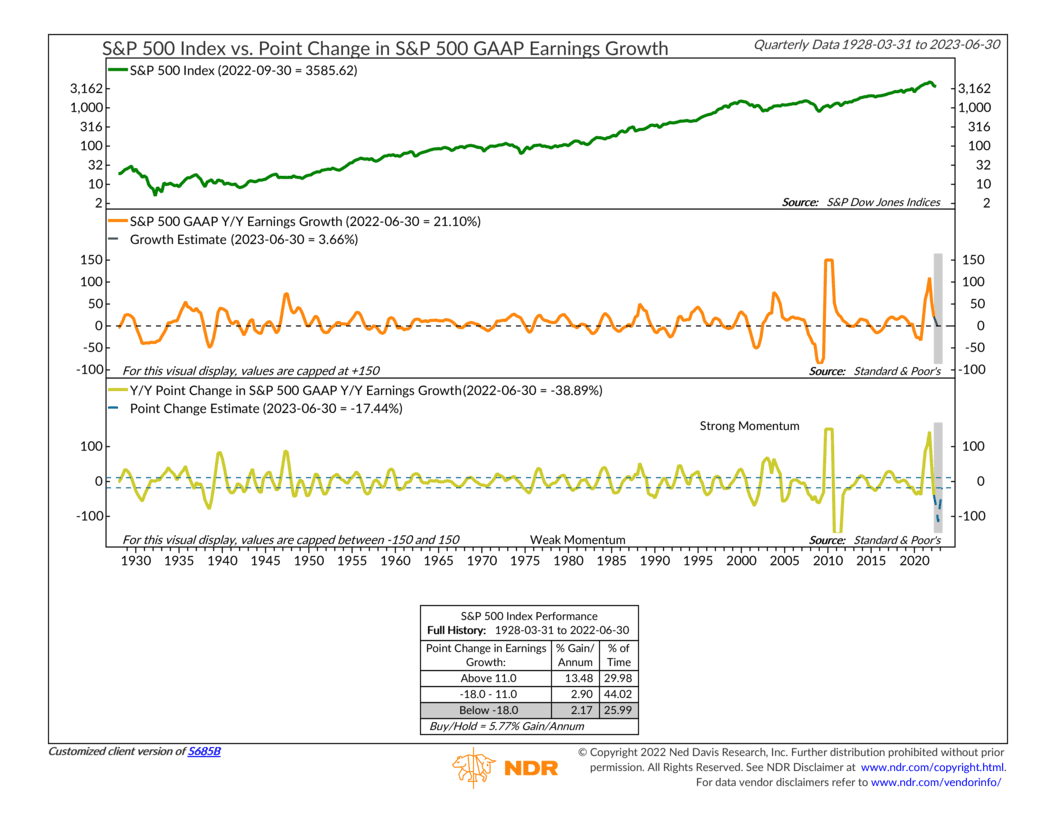
Here’s how it works. At the top of the chart above, we have the S&P 500 index. We use this broad index of large U.S. stocks as a proxy for “the stock market.”
In the middle clip, the orange line measures the year-to-year change in corporate earnings. Think of this as the annual growth rate of earnings.
And in the bottom clip, we have the measure that really matters. This gold line measures the year-to-year change in the annual growth rate of earnings. Basically, it measures how much the orange line changes from one year to the next.
This is important because the historical data show that the stock market performs the best—over 13% per year—when the year-to-year percentage point change in earnings growth is accelerating faster than about 11 points. Between -18 and 11 points, the market only returns about 2.9%, on average. And when the change in earnings growth is less than -18 percentage points, the market declines in value by about 2% per year.
This leads to some interesting observations.
For example, let’s look at the results from the recently completed second-quarter earnings. At first glance, things look pretty great. As the orange line in the middle clip shows, earnings grew roughly 21% versus a year earlier.
But, as the gold line in the bottom clip shows, this was 39 percentage points slower than the annual growth rate from the second quarter of 2021—which was about 60%. Since this is below the lower bracket (level of -18), the indicator is in a negative zone for stock returns.
From there, the dashed lines show that consensus estimates call for earnings growth to fall to -5.5% in the fourth quarter, which would put earnings growth roughly 115 percentage points lower than last year’s fourth quarter.
The bottom line? This indicator explains a lot of why the market has been under pressure in recent months. In a nutshell, we are going from a period of fast earnings growth acceleration (2021) to a period of sharp earnings deceleration (2022). Historically, the market struggles as it tries to find its footing in this sort of environment.
This is intended for informational purposes only and should not be used as the primary basis for an investment decision. Consult an advisor for your personal situation.
Indices mentioned are unmanaged, do not incur fees, and cannot be invested into directly.
Past performance does not guarantee future results.