This week’s featured indicator looks at nonfarm unit labor costs. Unit labor costs measure how much a business pays its workers to produce one unit of output. To find it, we take the total compensation of workers, including wages and benefits (such as health insurance and retirement contributions), and divide it by total output. Additionally, since compensation is expressed hourly, and output per hour is productivity, unit labor costs are simply hourly compensation minus productivity.
By expressing unit labor costs in this way, we can see that increases in hourly compensation will increase unit labor costs. In contrast, increases in output per hour (i.e., labor productivity) reduces them. In other words, increases in labor productivity can offset the effect of wage increases on unit labor costs.
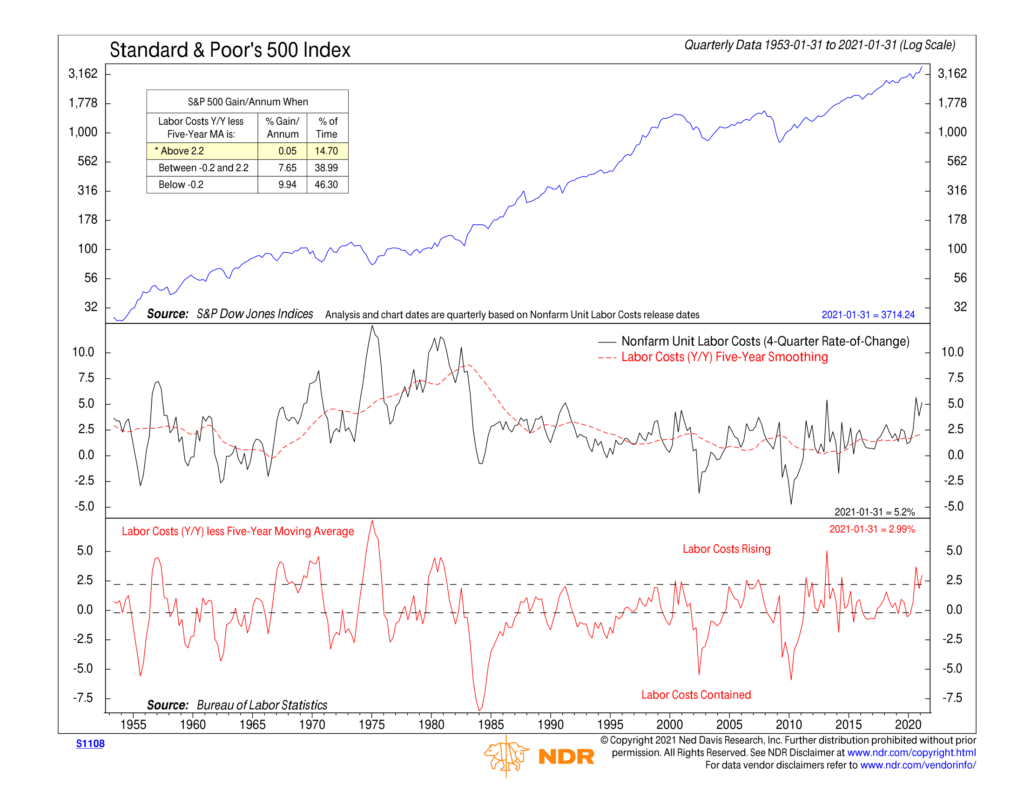
So how does this tie into the stock market? Well, if productivity gains are greater than or equal to compensation gains, profits will increase, and inflation will remain under control. Therefore, falling unit labor costs are bullish for stocks. However, if compensation outpaces productivity, the rising cost pressures will eat into corporate profits, thus creating headwinds for stock prices.
Our indicator above calculates how much nonfarm unit labor costs have increased over the past year (4 quarters) and subtracts its 5-year average. It reveals that when unit labor cost pressures are low (below the lower bracket), stocks have done well historically, returning nearly 10% per year, on average. However, when unit labor cost pressures are high (above the upper bracket), stocks have done poorly, returning just 0.05% per year, on average.
This is intended for informational purposes only and should not be used as the primary basis for an investment decision. Consult an advisor for your personal situation.
Indices mentioned are unmanaged, do not incur fees, and cannot be invested into directly.
Past performance does not guarantee future results.