Liquidity is one of those market words that gets thrown around a lot. But what does it actually mean?
At its core, liquidity is simply how much money is sloshing around in the financial system. When liquidity is plentiful, there is more capital available to flow into stocks, bonds, and other assets. But when liquidity is tight, markets tend to struggle because there is simply less fuel to push prices higher.
Historically, stock market returns have had a strong relationship with changes in liquidity. More money chasing assets tends to be supportive of prices. Whereas less money tends to create headwinds.
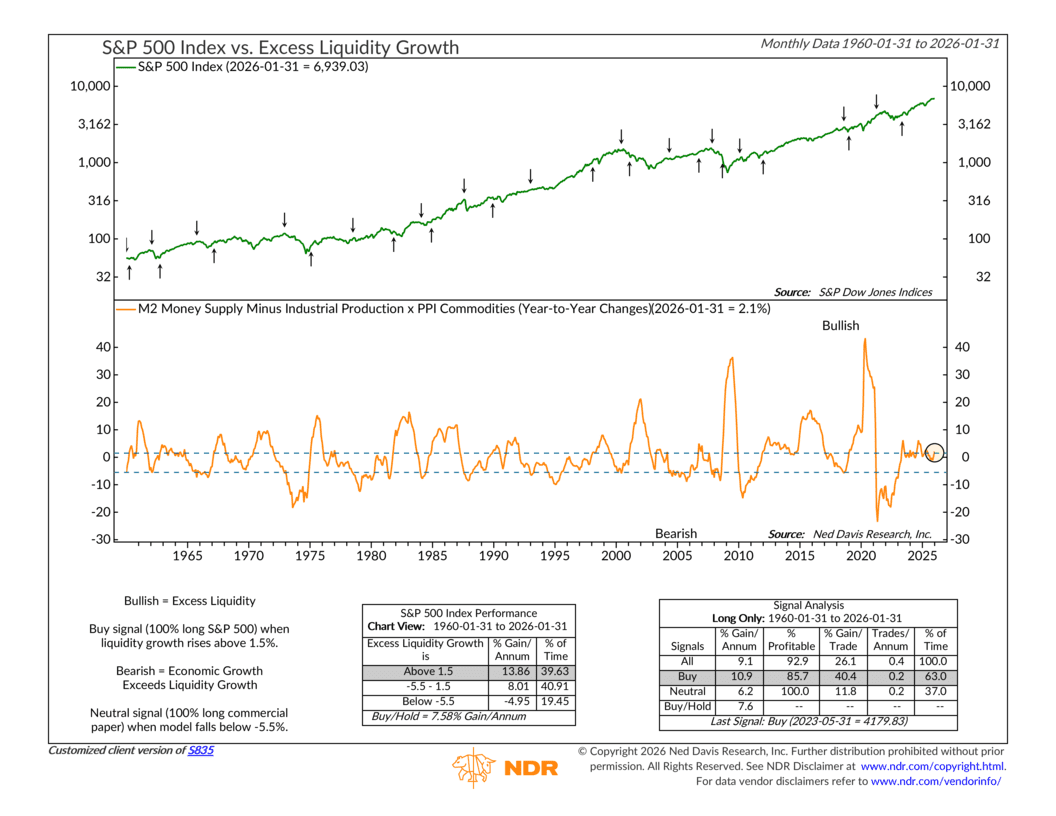
However, this week’s indicator, shown above, takes all this a step further. Rather than looking at money supply alone, it compares the growth in M2 money supply to the growth in industrial production and commodity inflation.
Why? Because industrial production and commodities represent demand for money inside the real economy. If economic growth and inflation are consuming liquidity faster than it is being created, financial markets can feel the squeeze.
In short, this handy indicator measures excess liquidity—how much money supply growth is left over after accounting for real economic demand.
Now, as the performance box shows, when excess liquidity rises above 1.5%, the model turns bullish—and S&P 500 returns go up substantially. And when the indicator falls deeply negative, it signals tighter financial conditions—and S&P 500 returns turn negative.
So where do we stand today? Well, over the past year, you’ve probably seen headlines highlighting strength in industrial production and resilience in commodity prices. On the surface, that could suggest liquidity is being absorbed by economic activity.
But last month’s update to the chart suggests otherwise. As you can see, while industrial production and commodity components have been firm, M2 growth has accelerated even more. As a result, excess liquidity has moved back above the bullish threshold. The indicator now sits at +2.1%, firmly in bullish territory.
This is good! Historically, as we mentioned above, periods when excess liquidity is positive have coincided with stronger stock market performance. When liquidity growth outpaces economic demand, that surplus capital tends to find its way into financial assets.
That does not guarantee short-term gains. Markets never move in a straight line. But from a broader perspective, the fuel tank looks like it has enough liquidity to support prices.
This is intended for informational purposes only and should not be used as the primary basis for an investment decision. Consult an advisor for your personal situation.
Indices mentioned are unmanaged, do not incur fees, and cannot be invested into directly.
Past performance does not guarantee future results.
The S&P 500 Index, or Standard & Poor’s 500 Index, is a market-capitalization-weighted index of 500 leading publicly traded companies in the U.S.