You can kind of think of the stock market as existing in one of two states, either above water or below water. By that, I’m referring to the market’s trend. Is it generally moving higher, or drifting lower?
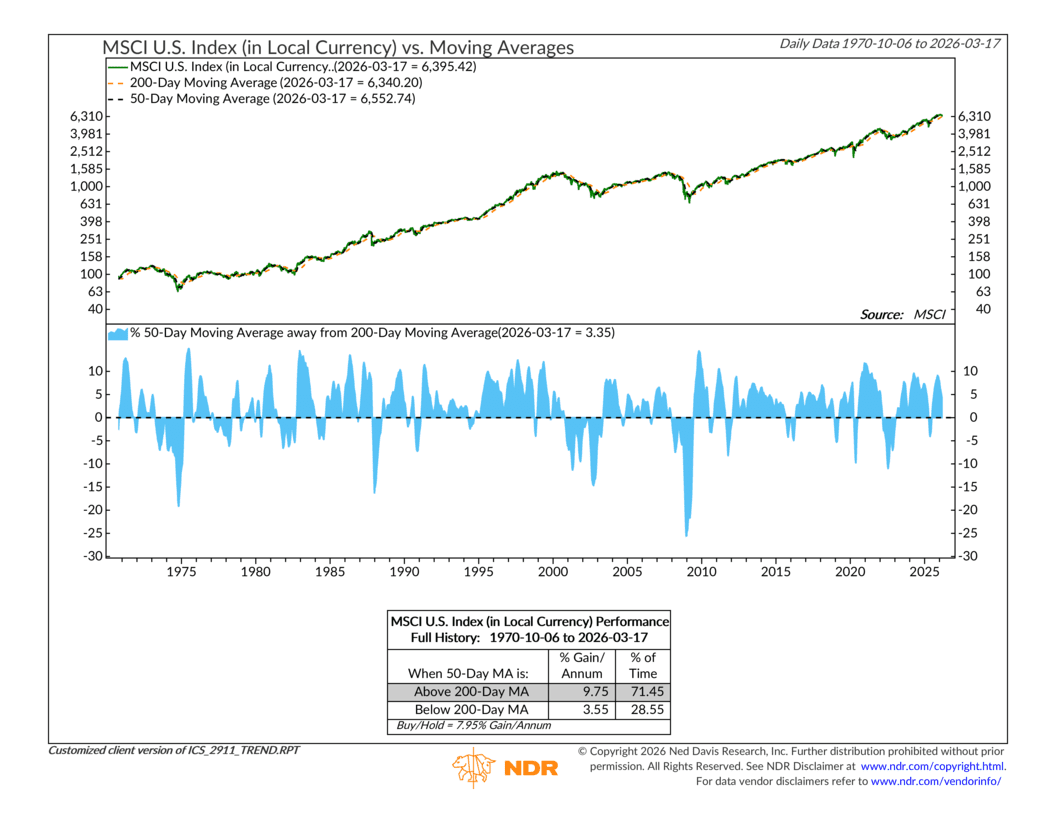
To put some structure around that idea, we can look at two widely followed technical measures, the 50-day moving average and the 200-day moving average. The 50-day reflects the market’s short-term trend, while the 200-day captures the longer-term trend. When the 50-day is above the 200-day, the trend is positive. When it falls below, the trend turns negative.
Visually, this shows up as those blue rolling hills on the bottom half of the indicator. I like to think of this as “the tide.” When the tide is positive, meaning above zero, the market is trending higher and often building momentum. When it’s negative, the market is below water and generally struggling to gain traction.
This matters because, historically, most of the market’s gains have come when the trend is positive. The green line in the top panel shows the MSCI U.S. Index, while the performance box breaks down returns in each state. The difference is pretty clear. When the market is above its 200-day moving average, returns have averaged around 9.75% annualized, compared to just 3.55% when it’s below.
So where are we today?
Looking at a zoomed-in view of the indicator, you can see the moving averages more clearly. The 50-day, shown as the black dashed line, has been closing the gap with the 200-day, shown in orange. As that spread narrows, the tide on the bottom panel has been slipping lower.
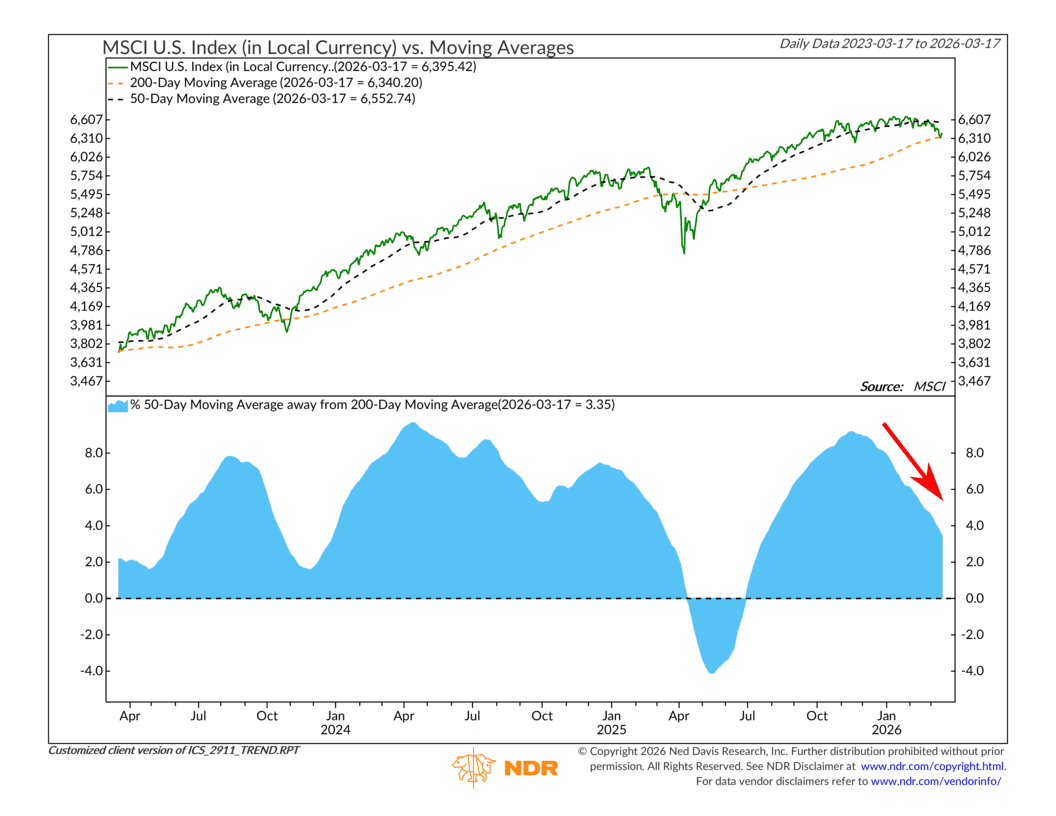
That’s a sign the market is losing momentum, and it puts us in a more fragile position. If that short-term trend continues to weaken and crosses below the long-term trend, it would mark a shift to a below-water environment. And historically, that’s where returns become harder to come by and risk tends to rise.
While we haven’t fully shifted to a below-water environment yet, this deterioration is another piece of evidence pointing in that direction. When you layer this in with the broader signals we’re tracking, it adds to the growing weight of the evidence that we’re in a Risk Off environment, at least for the time being.
This is intended for informational purposes only and should not be used as the primary basis for an investment decision. Consult an advisor for your personal situation.
Indices mentioned are unmanaged, do not incur fees, and cannot be invested into directly.
Past performance does not guarantee future results.
The MSCI USA Index is designed to measure the performance of the large and mid cap segments of the US market. The index covers approximately 85% of the free float-adjusted market capitalization in the US.