This week’s indicator focuses on the AMEX Securities Broker/Dealer Index. If you’re not familiar with it, this index tracks companies in the securities brokerage business and related areas. It works like a barometer for activity inside the investment services industry, and over time it has tended to move in step with the stock market because broker-dealers sit at the center of trading activity.
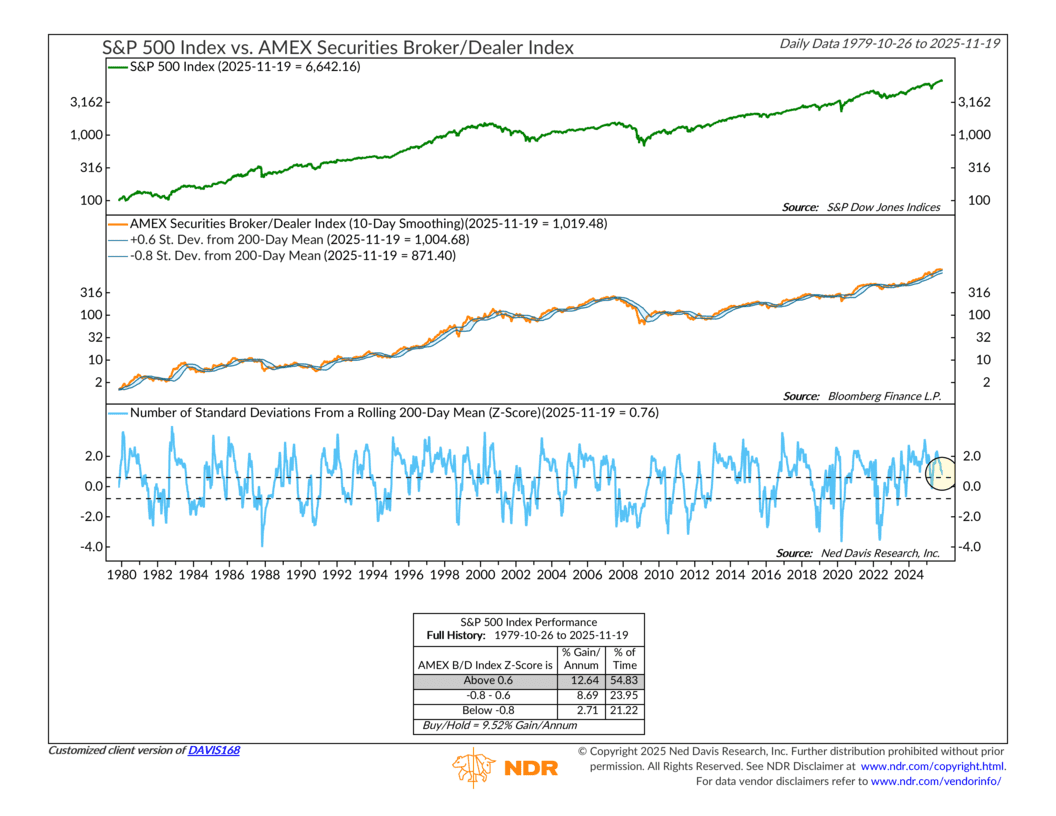
The chart above shows the S&P 500 in the top panel and the Broker/Dealer Index in the middle panel, with history going back to the late seventies. Even at a glance, you can see how closely they’ve moved together. However, the more actionable piece is the z-score in the bottom panel. It measures how far above or below the index sits from its rolling 200-day average.
As the performance table at the bottom shows, readings above 0.6 standard deviations have historically lined up with stronger annual returns for the S&P 500. Readings below minus 0.8 have been associated with weaker returns and more volatility. Readings in the middle? They have been closer to long-run averages.
Okay, so why is this indicator important? Because it falls under a category of indicator that we describe as monetary. It’s monetary because broker-dealers are very sensitive to liquidity and credit conditions. When monetary policy tightens or eases, their business feels it almost immediately. Therefore, their performance gives us a real-time read on how supportive the financial environment is for risk assets.
What’s it saying right now? Well, the z-score currently sits a 0.76, which is bullish. However, it’s been trending down lately, and it’s well off the peak it hit around this time last year. This means that while the market’s underlying financial conditions, according to broker-dealers, remain strong, they are also starting to deteriorate. This will be something to keep an eye on going forward.
The bottom line? Broker-dealers remain in positive territory, which supports the broader market backdrop, but the recent slippage in the z-score signals that monetary tailwinds may be easing. Although not a warning sign on its own, it does remind us to stay alert to any further decline in liquidity-sensitive areas.
This is intended for informational purposes only and should not be used as the primary basis for an investment decision. Consult an advisor for your personal situation.
Indices mentioned are unmanaged, do not incur fees, and cannot be invested into directly.
Past performance does not guarantee future results.