Here’s a stock market trading strategy: Buy rising stocks and sell falling stocks. It’s simple. It makes sense. But it’s easier said than done.
Enter our featured indicator of the week. It executes this simple trading strategy in a more rigorous and analytical way.
We call it the Net New 30-Day High Reversal indicator. The idea is that if the number of stocks trading at brand new highs over the past 30 days is starting to pick up momentum, it’s a good thing for the broader stock market. However, if the number of stocks hitting new highs starts to trail off, that’s bad for stocks overall.
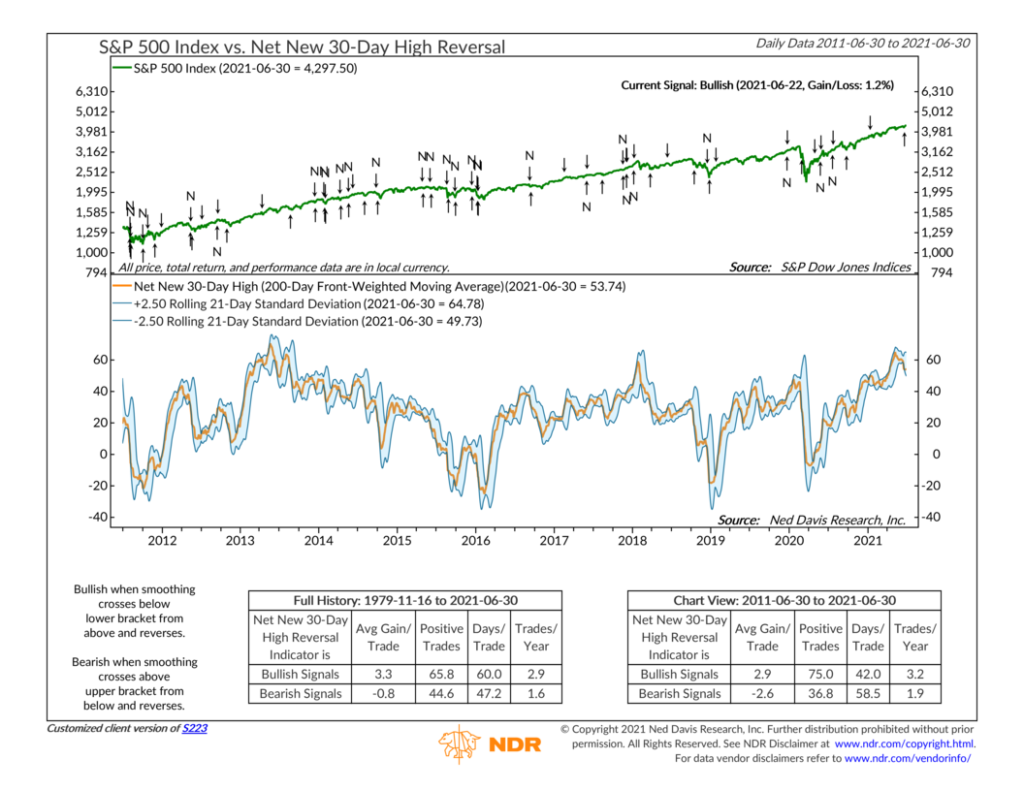
It works as follows. We use the S&P 500 stock index (shown in the top clip of the chart) as our proxy for the stock market. In the bottom clip of the chart, we plot the net new 30-day highs of the S&P 500, which is calculated by subtracting the 30-day new lows from the 30-day new highs. (We also apply a 200-day front-weighted moving average to this series to smooth out volatility).
The indicator triggers a positive signal when the measure falls -2.5 standard deviations below its 21-day moving average (lower blue bracket) and reverses. This adds a different flavor to the “buy rising stocks and sell falling stocks” strategy mentioned above. Here, we wait for the number of stocks hitting new highs to reach a short-term lower extreme and then reverse. The idea is that the momentum from the newly rising stocks will carry forward into the future and pull the rest of the market with it.
Of course, it works in reverse too. The indicator triggers a negative signal when the measure rises 2.5 standard deviations above its 21-day moving average (upper blue bracket) and reverses. This is generally a sign that stocks have gotten too far ahead of themselves, a warning that short-term weakness is likely.
For the history of the indicator, going back to 1979, its performance has been pretty good. On average, the S&P 500 has had a 3.3% gain per trade after positive signals and a 0.8% loss per trade after negative signals. In more recent history (the past ten years), the performance differential between positive and negative signals has been even more pronounced: 2.9% average gain per trade after positive signals versus 2.6% average loss after negative signals.
Overall, this makes it a compelling indicator to use in conjunction with other price-based indicators to ensure that you always have your finger on the pulse of the stock market.
This is intended for informational purposes only and should not be used as the primary basis for an investment decision. Consult an advisor for your personal situation.
Indices mentioned are unmanaged, do not incur fees, and cannot be invested into directly.
Past performance does not guarantee future results.