
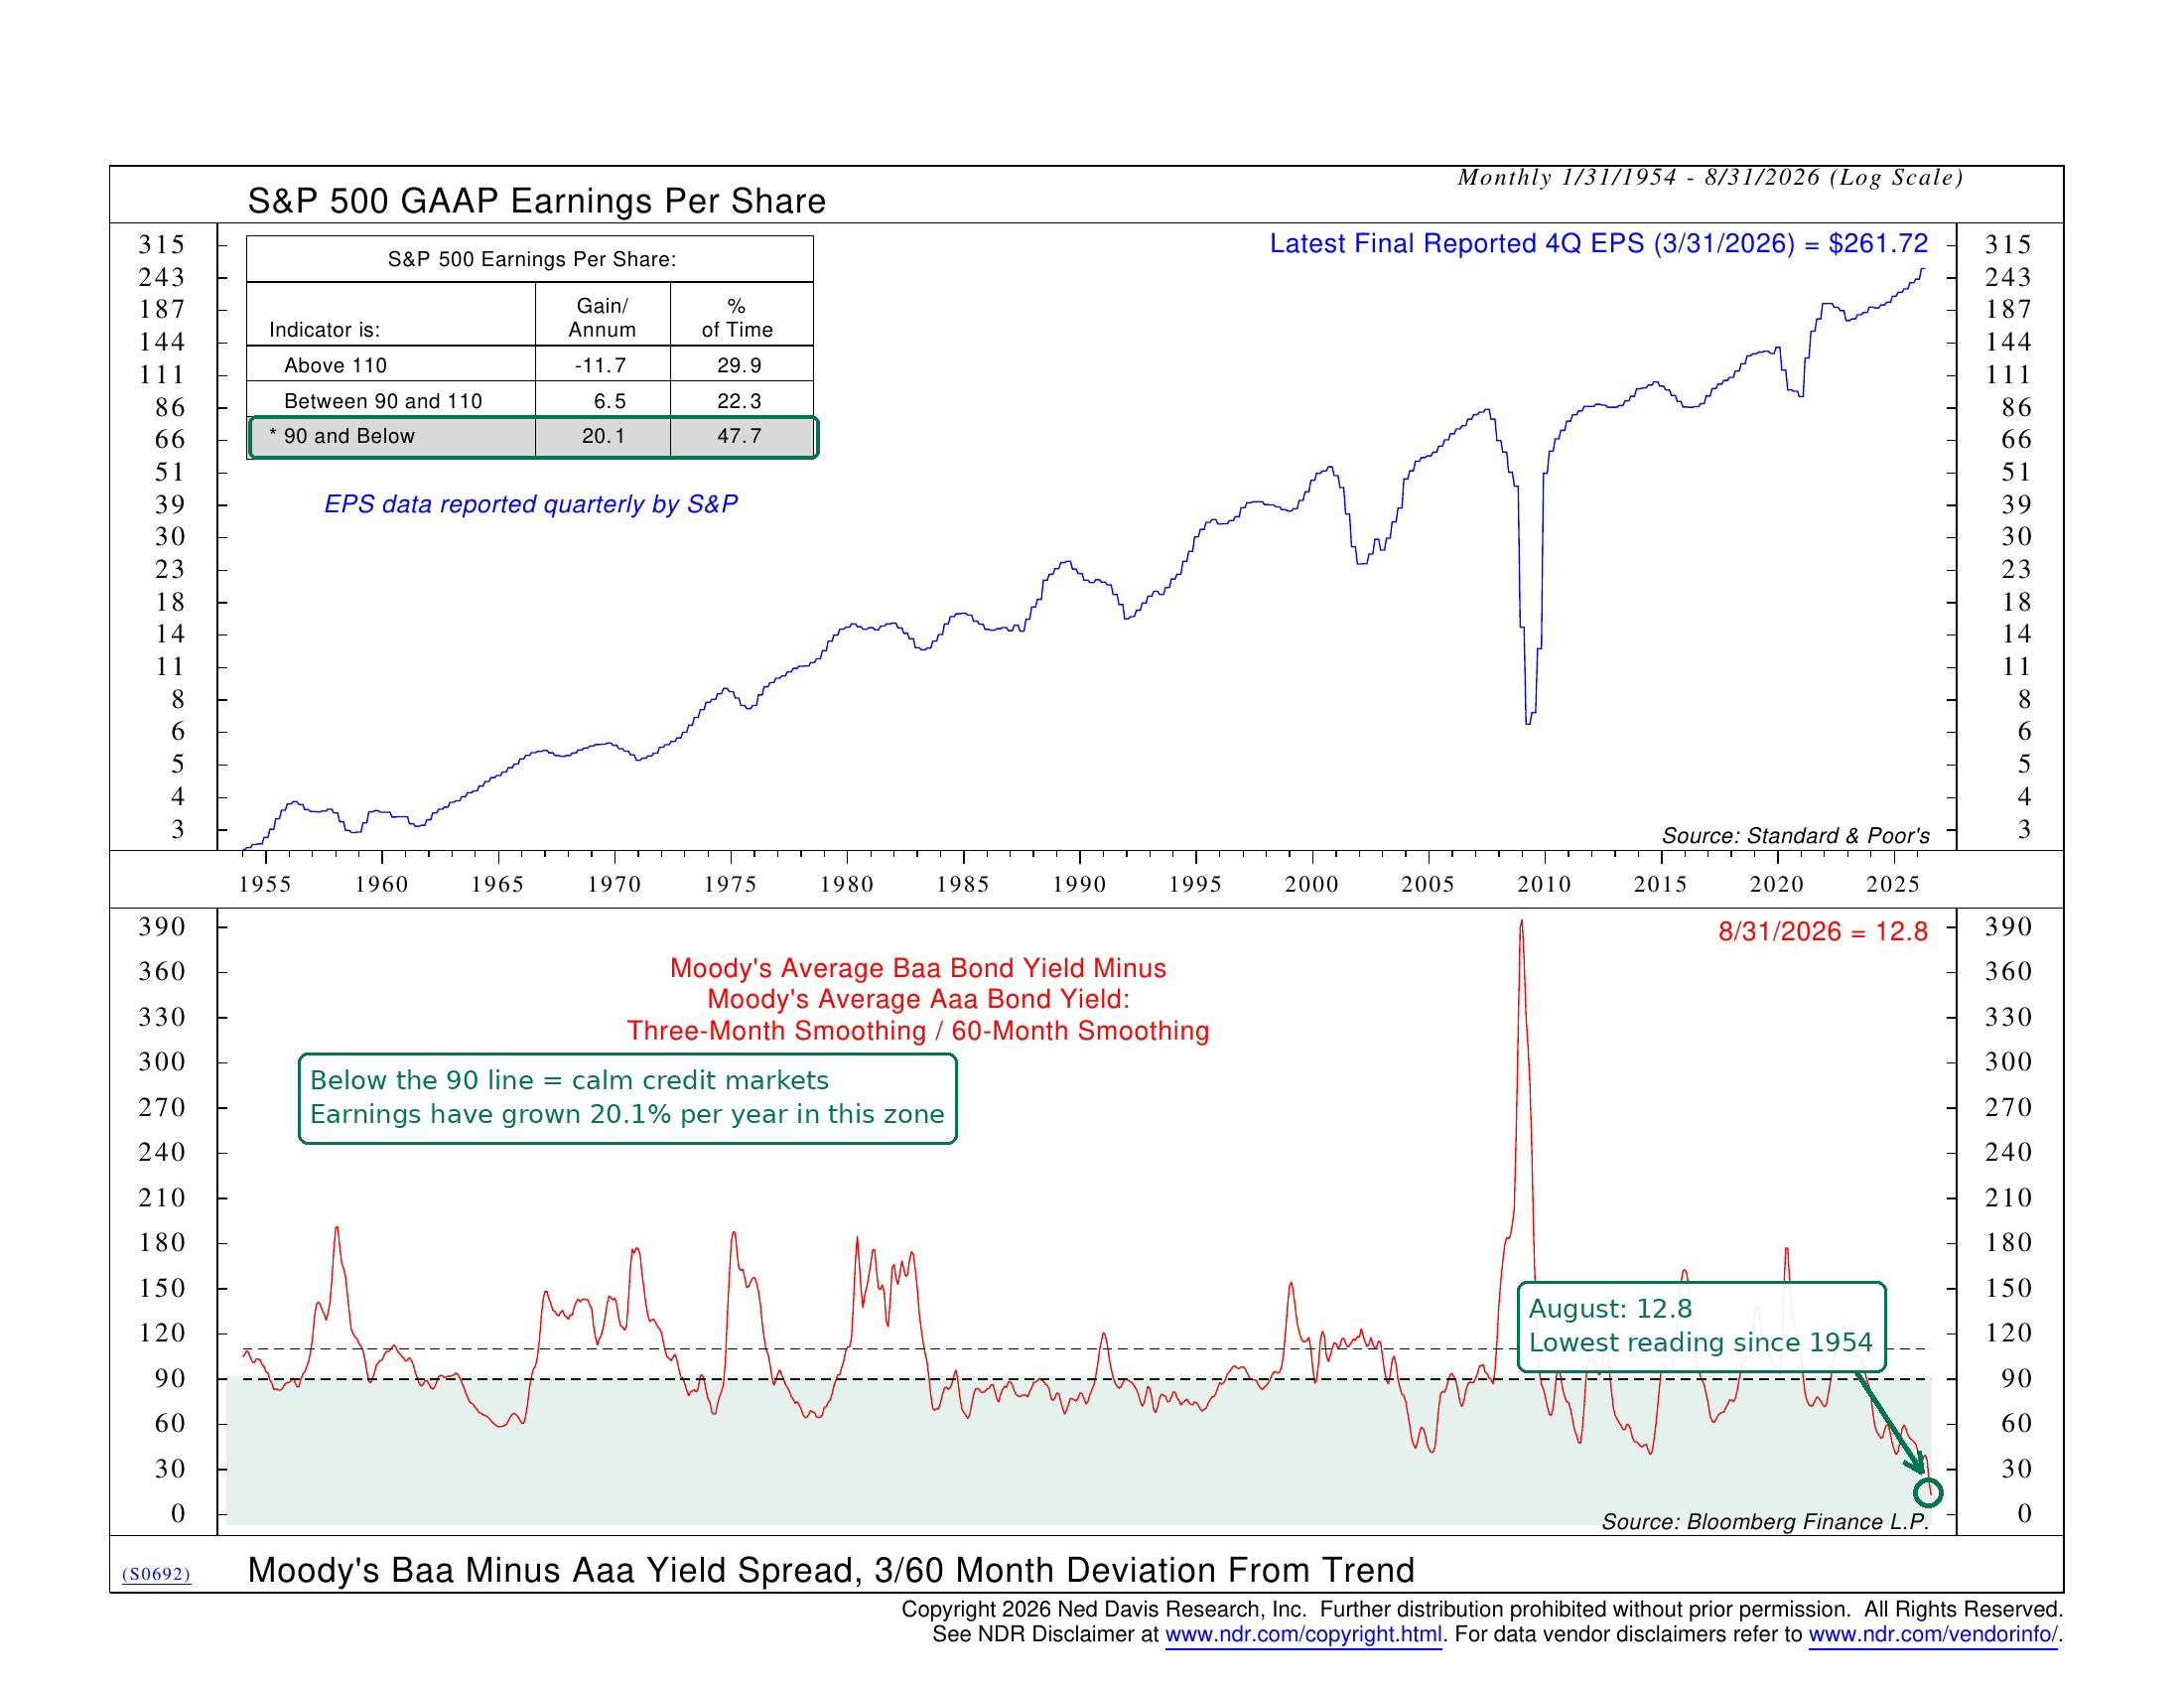
Last week, the question came up of whether tighter credit conditions are starting to create risk for the market. It’s a fair question. The Fed just raised rates for the first time in years, and credit usually tightens when that happens. So this week, I want to look at one of the cleaner ways to measure stress in the credit market.
Here’s how it works. The bottom section of the chart above tracks the gap between the yields on Baa-rated corporate bonds and Aaa-rated corporate bonds. Aaa is the highest credit rating a company can get. Baa is the lowest rung that still counts as investment grade. When investors get nervous, they demand a lot more yield to hold the riskier Baa bonds, and the gap widens. When they feel confident, the gap narrows.
The indicator then compares a short-term average of that gap to its five-year average. A reading of 100 means the spread is right at its longer-term trend. Above 110 means credit stress is rising faster than normal. Below 90 means it is unusually calm.
The top section of the chart shows S&P 500 earnings per share going back to 1954. That is the part that makes this indicator interesting. Rather than stock prices, it pairs the health of the credit market with the health of corporate profits.
The history of the indicator shows an interesting pattern. When it’s above 110, earnings have fallen at an 11.7% annualized rate. That has happened about 30% of the time. Between 90 and 110, earnings grew 6.5% per year. And when the indicator has been below 90, earnings have grown at a 20.1% annualized rate. That has been the case nearly half the time.
The logic makes sense. Companies borrow to invest, hire, and grow. When credit is cheap and easy, profits tend to follow. When lenders pull back, profits usually suffer soon after.
So where are we now? As of the end of August, the indicator sat at 12.8. That is not a typo. It is the lowest reading in more than 70 years of data. The spread between Baa and Aaa yields is as tight relative to its trend as it has ever been. Credit markets are telling us there is almost no stress in the system right now.
That lines up with what we have been seeing elsewhere. Corporate balance sheets are in good shape. Interest coverage is healthy across most sectors. And despite higher rates, lenders have not pulled back.
Now, a reading this extreme deserves some caution. When something has never been this calm before, it is worth asking whether investors have become too comfortable. Tight spreads can also mean investors aren’t being paid much for taking credit risk. And credit conditions typically do tighten as a rate-hiking cycle wears on. The indicator can move from calm to stressed fairly quickly, as it did in 2008 and again in 2020.
So far, though, none of that has shown up in the data. For now, the message from the credit market is that the backdrop for corporate earnings remains supportive. Earnings have been the engine of this bull market, and this indicator suggests the fuel line is still clear.
The bottom line? Of all the things investors are worried about right now, credit stress is not one of them. That could change, and a reading this extreme is worth watching closely. But as long as this indicator stays in its lower zone, history says the earnings picture should hold up.
This is intended for informational purposes only and should not be used as the primary basis for an investment decision. Consult an advisor for your personal situation.
Indices mentioned are unmanaged, do not incur fees, and cannot be invested into directly.
Past performance does not guarantee future results.
The S&P 500 Index, or Standard & Poor’s 500 Index, is a market-capitalization-weighted index of 500 leading publicly traded companies in the U.S.
Moody’s Seasoned Aaa and Baa Corporate Bond Yield indices measure the average yield on long-term U.S. corporate bonds rated Aaa (highest quality) and Baa (lowest investment-grade quality), respectively, by Moody’s Investors Service.