The stock market loves liquidity. By liquidity, we’re referring to the amount of easily accessible cash sloshing around the financial system. In our modern world of banking, one of the best ways to measure liquidity is by looking at the amount of bank reserves in the system.
What are bank reserves? They’re the funds banks hold in reserve with the Federal Reserve, our central bank. They’re a component of the money supply—what we call “base money”—since they help banks manage their day-to-day liquidity needs, such as meeting withdrawal demands from depositors and settling transactions with other banks. They’re also a tool the Federal Reserve uses to adjust interest rates and overall economic activity, which tend to correlate with stock prices.
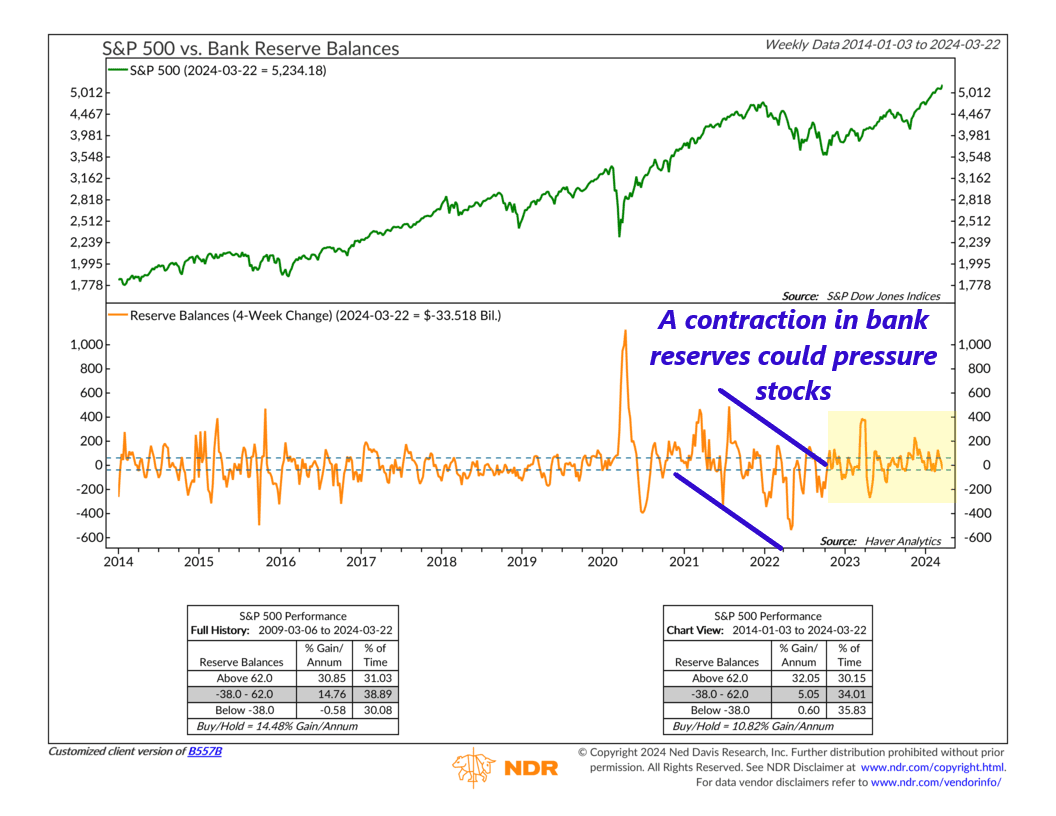
Our indicator above shows how the 4-week change in bank reserve balances (orange line, bottom clip) has historically influenced stock prices (the S&P 500 Index, green line, top clip). As the performance box reveals, when the 4-week change in bank reserves has exceeded $62 billion, the S&P 500 has done stellar—whereas a contraction in bank reserves (below -$38 billion) has led to paltry returns.
For example, as highlighted on the chart, bank reserves started contracting in 2022, as the Fed began increasing rates and reducing reserves in the system to choke off inflation. Sure enough, we ended up with negative S&P 500 returns that year.
Since 2023, however, bank reserves have been more stable, mostly trending in the neutral zone on the chart. This was a sign that the Federal Reserve was easing off its tightening cycle, essentially pausing rate hikes, and that has been a favorable tailwind for stocks.
The risk, therefore, is if we start to see reserves contracting in the system once again. Currently, the 4-week change in reserves is about -$33.5 billion. A dip below -$38 billion would put the indicator in its most negative zone for stock returns historically.
That doesn’t mean stocks will automatically sell off if that happens, as many different factors affect stock returns outside bank reserves, but it probably won’t help, either.
This is intended for informational purposes only and should not be used as the primary basis for an investment decision. Consult an advisor for your personal situation.
Indices mentioned are unmanaged, do not incur fees, and cannot be invested into directly.
Past performance does not guarantee future results.
The S&P 500 Index, or Standard & Poor’s 500 Index, is a market-capitalization-weighted index of 500 leading publicly traded companies in the U.S
