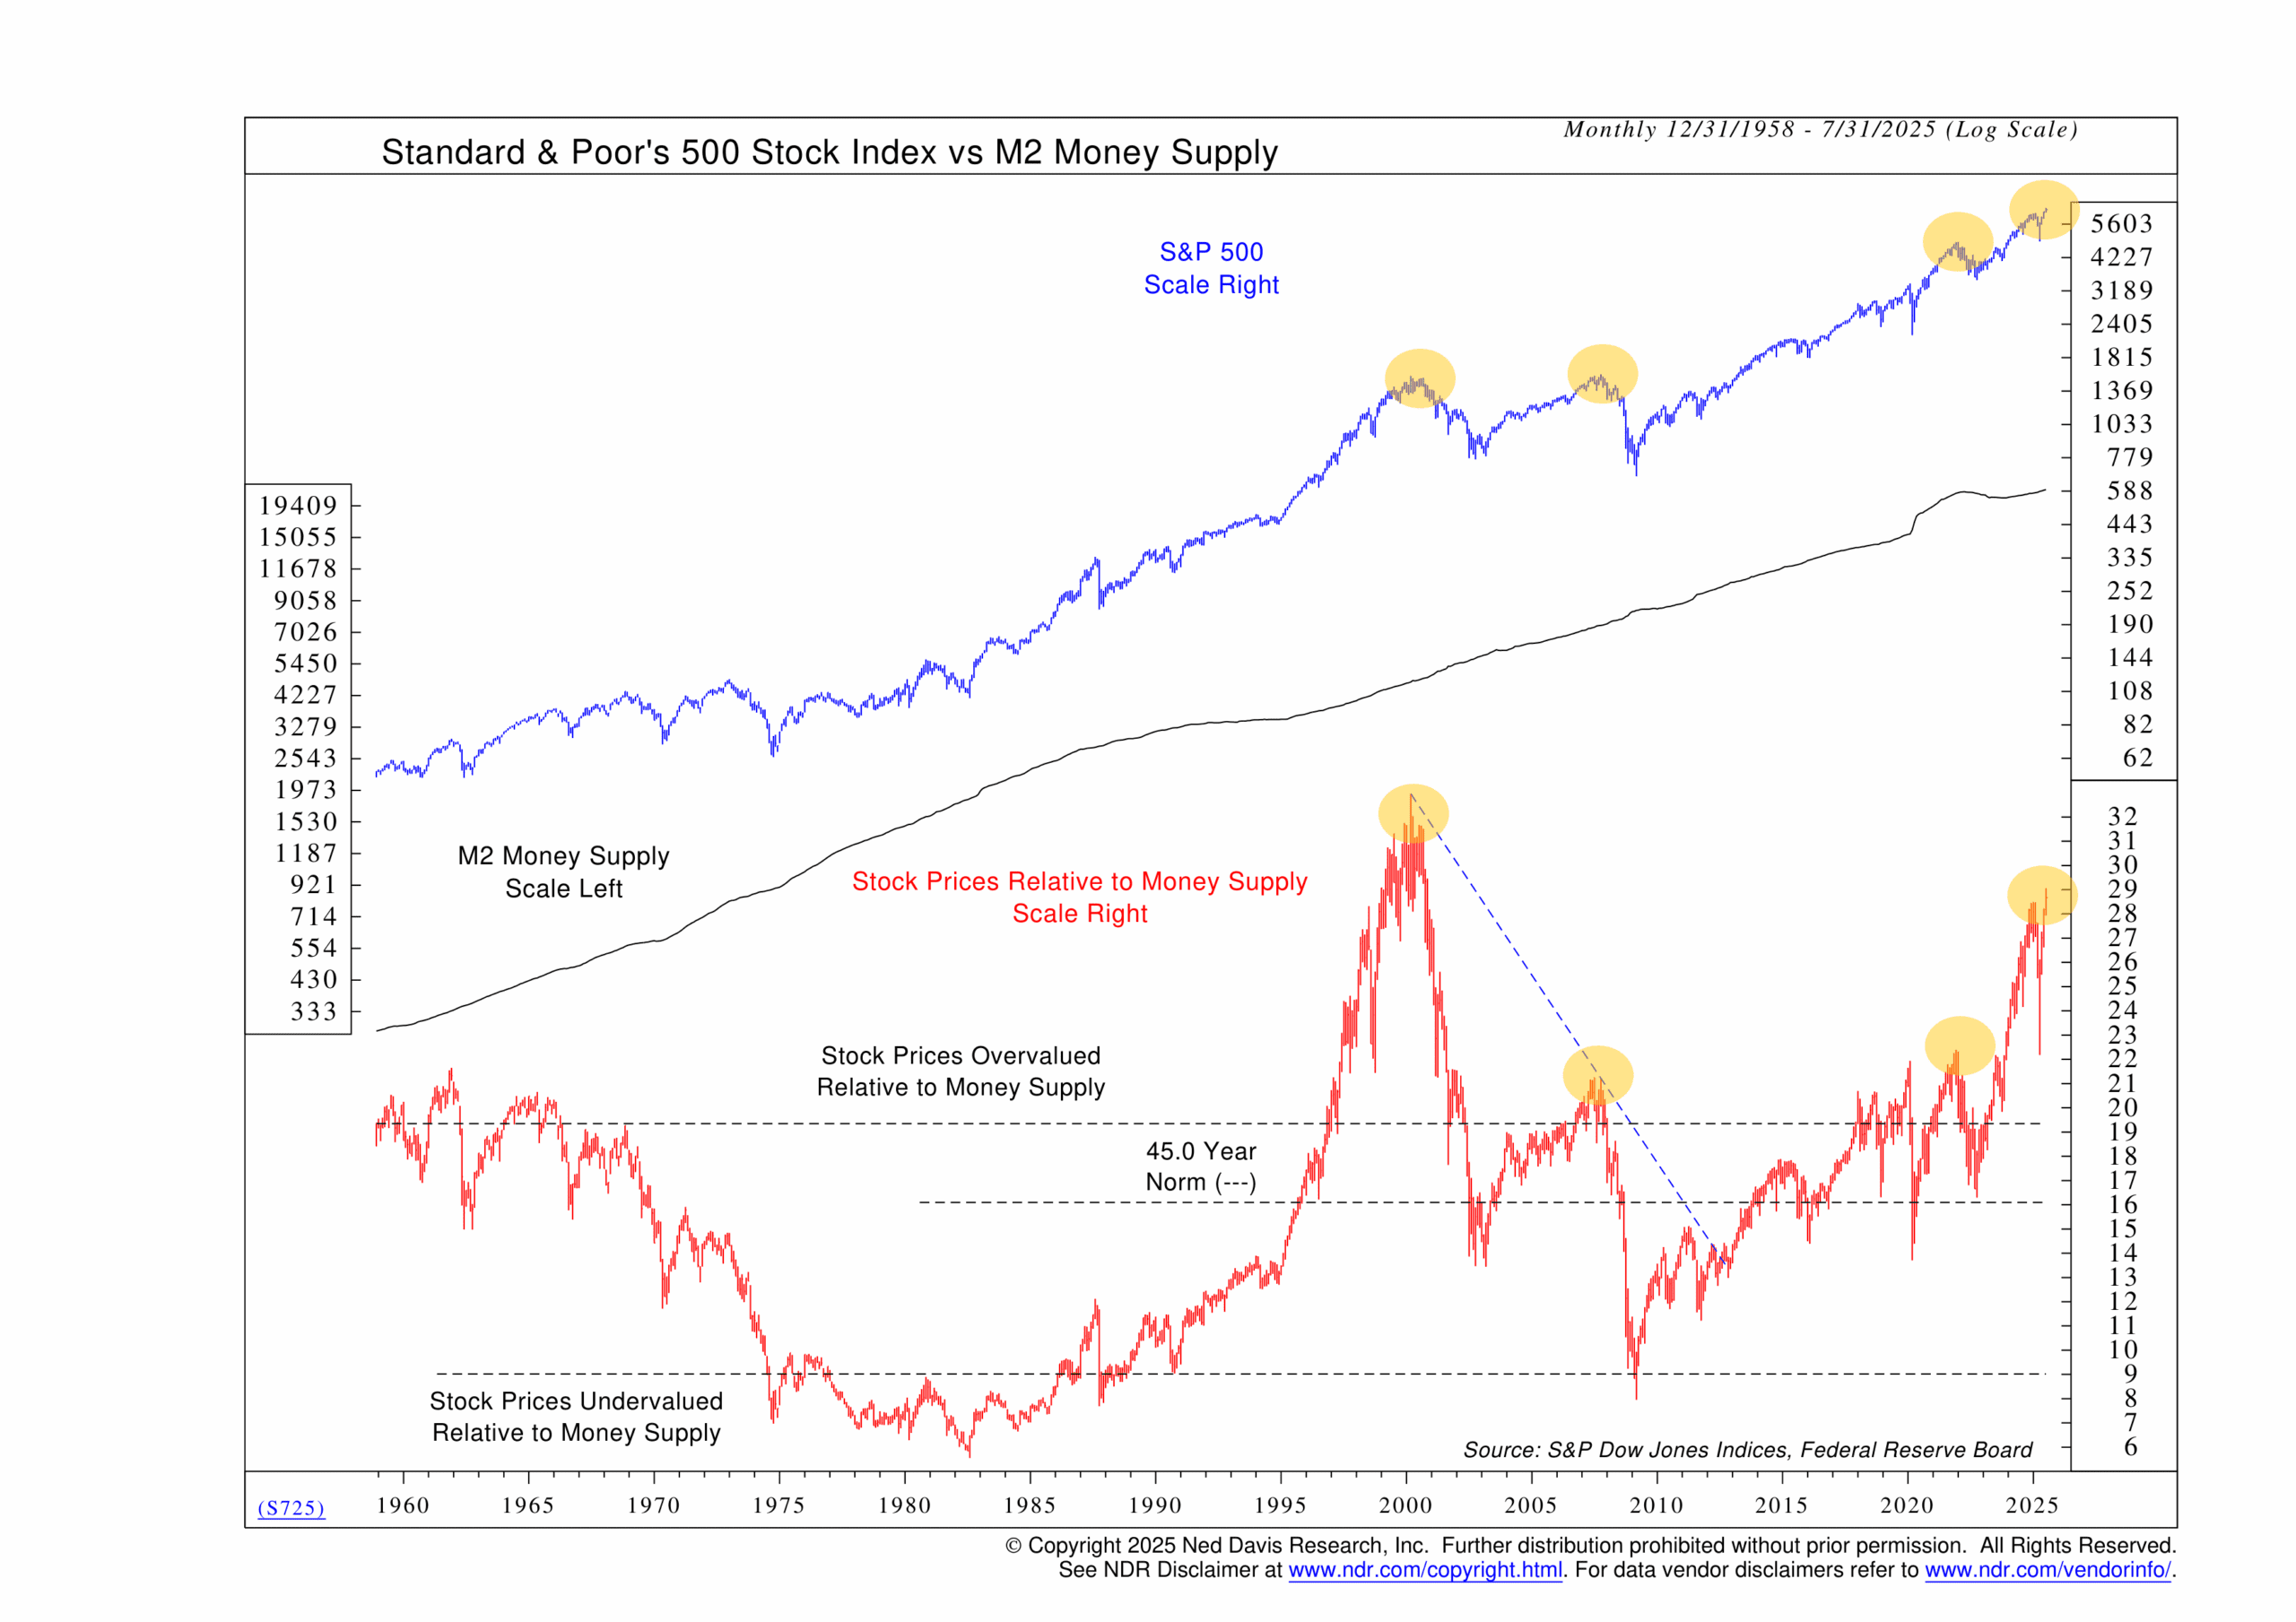
Have you ever noticed how a truck can only pull so much before the trailer starts to sway? Sure, you can push it a little, but eventually, the load and the power have to stay in balance. The stock market works in a similar way when you compare it to the amount of money in the economy. When prices get too far ahead of the money supply, history shows things have a way of evening out.
That’s what this week’s indicator is all about. It takes the S&P 500, our benchmark measure of U.S. stocks, and divides it by something called M2, which is basically the amount of money floating around in the system. The ratio tells us whether stocks are stretched compared to the fuel that usually supports them—money.
Looking back at the history of this indicator, we see that this measure has given some pretty clear warning signs. The ratio shot up in the late 1990s, right before the dot-com bubble, and again leading up to the 2008 financial crisis. In both cases, the ratio came back down eventually, but not because of magic. Either the Fed added more money to the system, or stock prices fell.
Right now, the ratio has climbed to levels we’ve only seen at those kinds of peaks. The money supply has been flat since 2022, thanks to the Fed tightening, but stocks have kept climbing. That means prices are running a lot hotter than the money backing them up.
There are really only two ways this gap gets closed. Either the Fed opens the spigot again, pumping more dollars into the economy, or stock prices cool off until the relationship makes more sense. Neither path is particularly easy, though. More money risks bringing back inflation, and lower stock prices mean some near-term pain for investors.
The important thing to remember, though, is that we don’t need to try and time when this adjustment will occur. It’s enough to recognize that this imbalance exists, and that eventually, markets will work their way back to balance. We keep this indicator in the mix alongside many others, and when the weight of the evidence starts to lean a certain way, that’s when it makes sense to adjust.
This is intended for informational purposes only and should not be used as the primary basis for an investment decision. Consult an advisor for your personal situation.
Indices mentioned are unmanaged, do not incur fees, and cannot be invested into directly.
Past performance does not guarantee future results.
The S&P 500 Index, or Standard & Poor’s 500 Index, is a market-capitalization-weighted index of 500 leading publicly traded companies in the U.S.