What Does “Expensive” Really Mean?
Raise your hand if you’ve ever heard someone talking about the stock market being “cheap” or “expensive.”
But what does that even mean? Well, most of the time, people are referring to the price-to-earnings (P/E) ratio—how many dollars you’re paying for each dollar of company earnings. The higher the number, the more expensive the stock, and vice versa.
But what often gets missed in that conversation is context. Are stocks facing competition from other assets? Like bonds, maybe?
The Power of Relative Valuation
That’s where this week’s featured indicator comes in. It compares the earnings yield of the stock market to the yield on long-term government bonds. By stacking these two side by side, we can get a relative view of valuation—one that accounts for the bigger picture.
What the Chart Shows
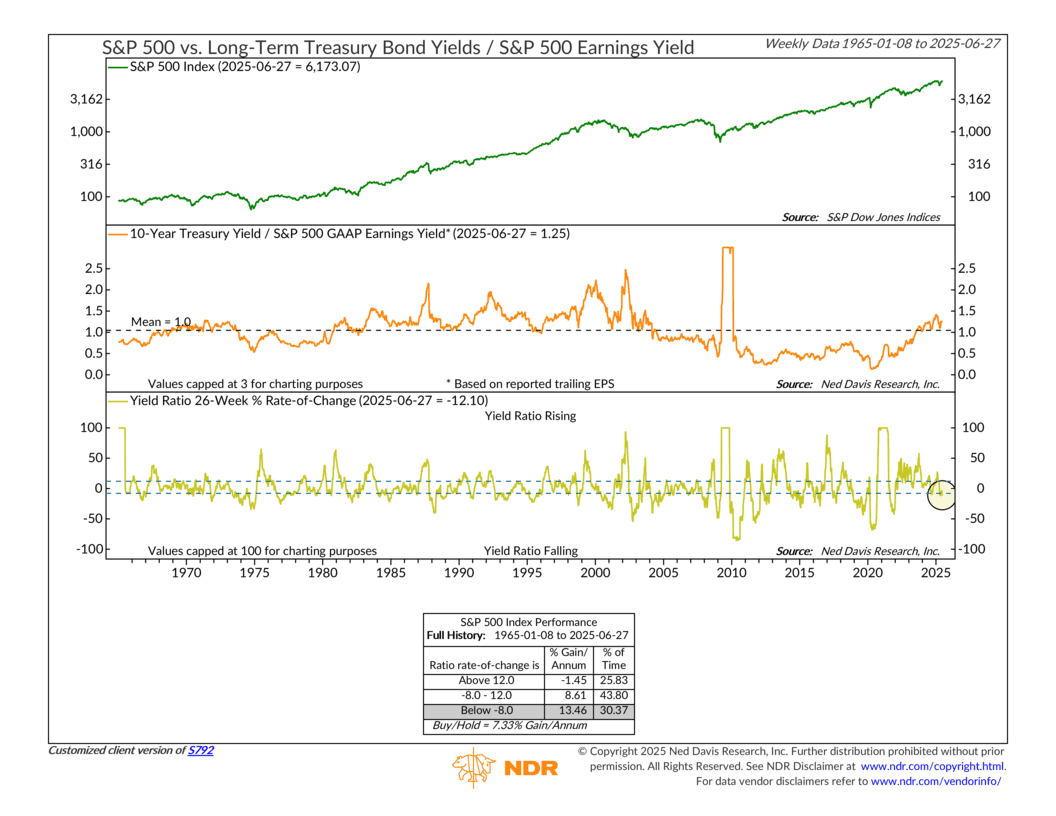
- Top Panel: The green line shows the S&P 500 index going back to 1965.
- Middle Panel: The orange line tracks the ratio of the 10-year Treasury yield to the S&P 500’s earnings yield (the inverse of the P/E ratio). When the ratio is high, bonds look more attractive. When it’s low, stocks tend to win out.
- Bottom Panel: This gold line measures the 26-week rate-of-change in that ratio. In plain terms, it tells us how fast things are shifting. Rising quickly? Bonds are gaining the edge. Falling fast? Stocks are reclaiming it.
Why It Matters
The performance box below the chart shows what’s happened historically when that rate-of-change moves sharply. When it drops below -8%, the S&P 500’s average annual return has been over 13%. When it’s rising, returns tend to fall off.
Think of this like a seesaw. On one side, stocks and their earnings. On the other, bond yields. When bond yields rise fast, they can pull investors away from stocks. When they stall or decline, money often flows back toward equities.
A Smarter Way to Think About Value
This approach lets us account for interest rate levels. Stocks may look pricey using traditional metrics, but if bond yields are low, stocks can still offer better value. That’s a big reason equities performed well throughout the 2010s and the post-COVID recovery—rates stayed low, so stocks stayed relatively attractive.
Where Things Stand Now
As of June 27, 2025, the earnings yield on the S&P 500 is being outpaced by the 10-year Treasury yield, pushing the ratio to 1.25—above its long-term average. But here’s what matters: the 26-week rate-of-change is now negative again, falling to -12.1%. That puts it in the historically favorable zone for stocks.
In other words, the pace at which bond yields had been outpacing stock earnings is now easing. That cooling effect has often lined up with stronger stock performance.
The Bottom Line
This indicator is a great example of why relative valuation matters. Looking at stocks without considering interest rates is like judging a restaurant by its price without checking what the place across the street charges. Sometimes, it’s not just about how expensive something looks—but how it stacks up to your other options.
This is intended for informational purposes only and should not be used as the primary basis for an investment decision. Consult an advisor for your personal situation.
Indices mentioned are unmanaged, do not incur fees, and cannot be invested into directly.
Past performance does not guarantee future results.
The S&P 500 Index, or Standard & Poor’s 500 Index, is a market-capitalization-weighted index of 500 leading publicly traded companies in the U.S.