Momentum can be an interesting thing to measure in markets. Due to the nature of how momentum is calculated (a rate of change), it often tends to fade before prices actually peak. Think of it like a homemade rocket. The speed at which it’s rising slows down quite a bit before it finally reaches a peak and rolls over.
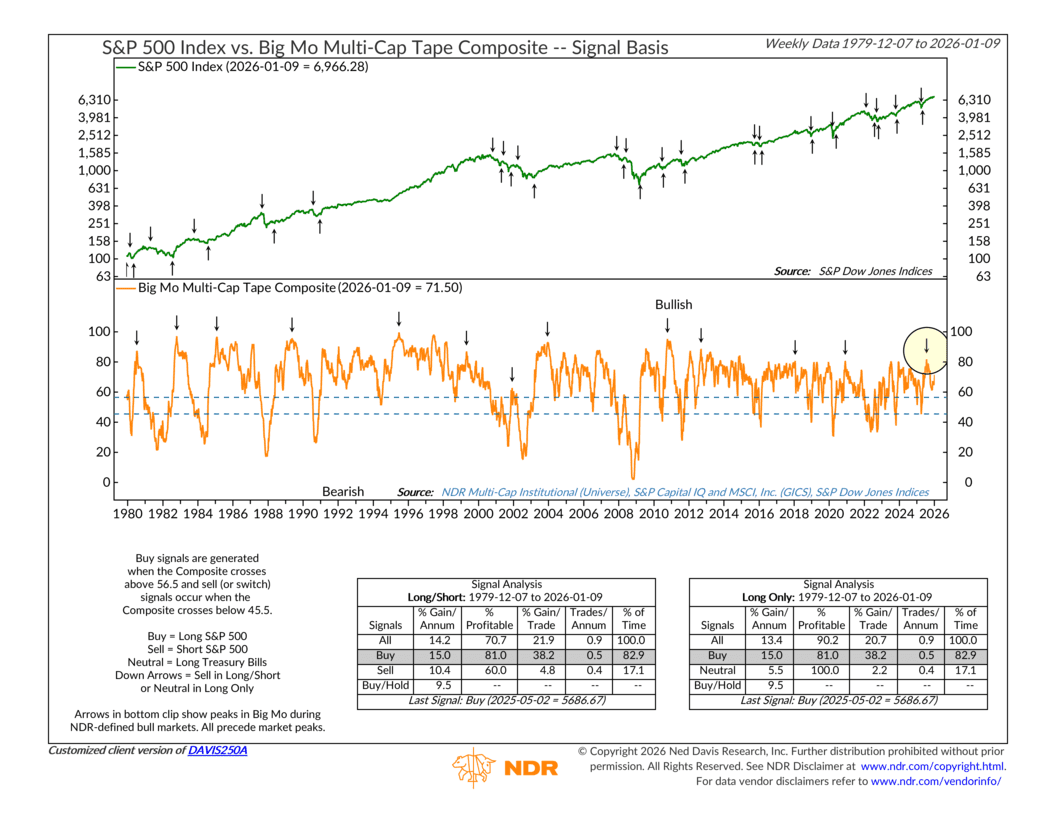
One of the best, most reliable indicators we have to measure momentum is the indicator shown above: NDR’s Big Mo Multi-Cap Tape Composite. We call it Big Mo for short. At a high level, Big Mo is designed to capture broad-based market momentum across market caps. It’s not really trying to time short-term pullbacks. Instead, it measures the strength and persistence of trends, which makes it especially useful for understanding where we are within a broader market cycle.
The top panel of the chart shows the S&P 500 over time, while the lower panel tracks Big Mo itself. The key detail sits in that bottom panel. To clarify, the down arrows do not represent sell signals. They mark momentum peaks. Historically—and this is key—these momentum peaks have occurred before the market itself has reached its final high for the cycle.
That distinction matters. As I mentioned above, momentum, by definition, is a rate-of-change measure. It tends to crest first, then prices continue higher for a period of time as the market works through the later stages of the bull market. In past cycles, that has often meant the bull market continued on, but with more volatility, narrower leadership, and really just less margin for error overall.
So where are we today? Well, Big Mo generated a new cyclical buy signal on May 2, 2025, which confirmed the broader uptrend that’s been in place since then. More recently, however, the indicator appears to have rolled over from the momentum peak in August 2025.
In other words, it appears we are likely entering into the latter phases of this bull market.
Now, I want to reiterate that this does not imply an imminent top or a sell signal. Our longer-term cycle work still suggests the bull market could extend into early 2026. But history shows that once momentum has peaked, the environment tends to change. Returns can become more uneven, and risk management becomes more important.
The takeaway is straightforward. Big Mo is telling us the trend remains intact, but the pace has slowed. This can still be a favorable environment for risk assets, but there are signs that the cycle has matured and may be moving into the second half of its life.
This is intended for informational purposes only and should not be used as the primary basis for an investment decision. Consult an advisor for your personal situation.
Indices mentioned are unmanaged, do not incur fees, and cannot be invested into directly.
Past performance does not guarantee future results.
The S&P 500 Index, or Standard & Poor’s 500 Index, is a market-capitalization-weighted index of 500 leading publicly traded companies in the U.S.