Sentiment is one of the more interesting aspects of the market that we measure. It’s interesting because it tends to work in a contrarian manner, meaning high levels of optimism tend to be bad for future stock returns, and vice versa.
Now, there are various ways to measure sentiment. You can take a survey. You can look at newsletter sentiment. You can even look at how investors are positioning their funds.
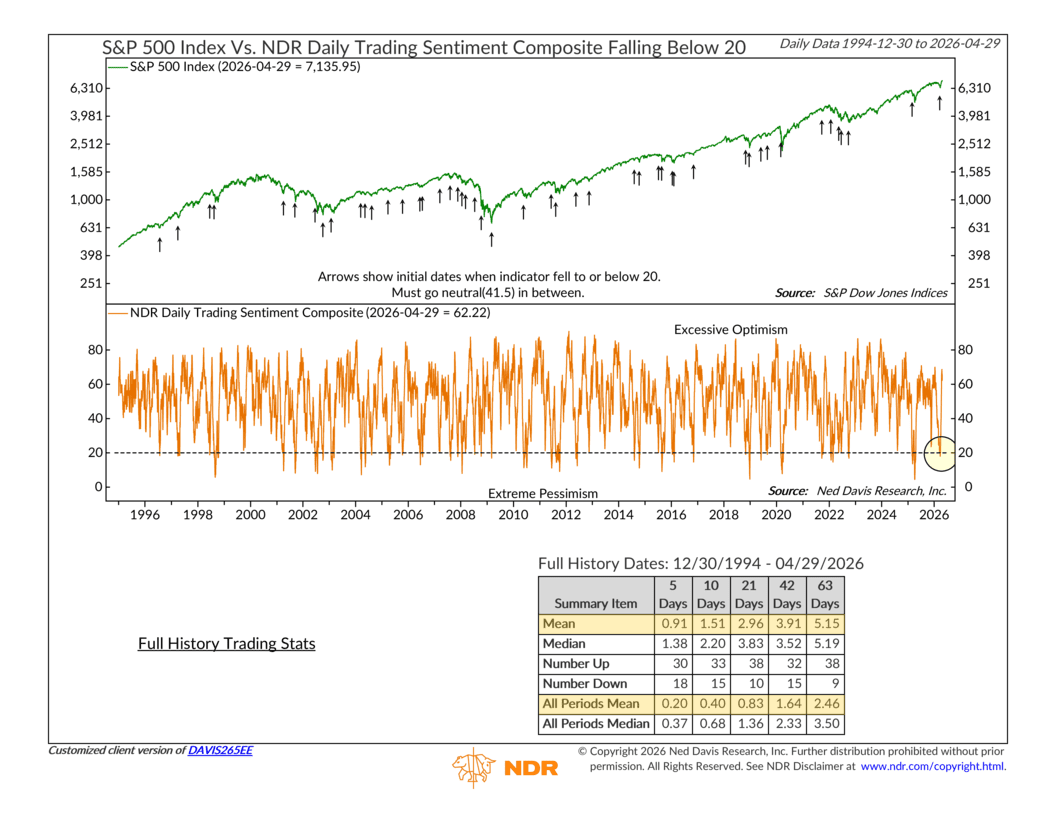
What this week’s indicator, NDR’s Daily Trading Sentiment Composite, does is combine all of those into a single number between 0 and 100. This number reflects the percentage of investors who are optimistic at any given moment, with higher numbers meaning more optimism, and vice versa.
But here’s what makes this particular indicator unique. It only focuses on what happens when sentiment falls below 20, marked by the dashed line on the chart. I call this a “pessimism plunge,” because it marks the moment when investors become super bearish all at once.
This is important because, historically, these pessimism plunges have produced strong, positive future returns for the S&P 500.
Since 1994, there have been 48 of these plunges. Over the 21 trading days following each signal, the S&P 500 has gained an average of 2.96%, more than three times the 0.83% average gain for any random 21-day period.
Stretch that out to three months, and signal periods have averaged a 5.15% gain versus just 2.46% for all periods.
And it works more often than not. 38 of those 48 signals were followed by positive 21-day returns, a nearly 80% success rate.
The most recent pessimism plunge came on March 20th, right in the middle of the Iran war selloff. Oil was spiking, and the headlines looked grim. But after that sharp drop in sentiment, the indicator fired a buy signal.
The market dipped a bit further in the immediate days that followed, down another 2.1% over the first five days. But then it turned sharply. Over the next 21 trading days, the S&P 500 climbed 8.6%, nearly three times the historical average for this signal and one of the stronger outcomes in the indicator’s history.
If you look at the indicator closely, you’ll notice that sentiment has since rebounded quite a bit. Today, the indicator sits at 62% bullish. That leans optimistic—but not overwhelmingly so. We will likely need to see sentiment get even more bullish from here before it gets to the point where it will start putting a lid on future returns.
So, the bottom line? Extreme pessimism has consistently created opportunity, and we saw that play out again in March. Sentiment has recovered since then, but it hasn’t reached the kind of excess that typically signals trouble. For now, this remains more of a supportive backdrop than a warning sign.
This is intended for informational purposes only and should not be used as the primary basis for an investment decision. Consult an advisor for your personal situation.
Indices mentioned are unmanaged, do not incur fees, and cannot be invested into directly.
Past performance does not guarantee future results.
The S&P 500 Index, or Standard & Poor’s 500 Index, is a market-capitalization-weighted index of 500 leading publicly traded companies in the U.S.