
A big challenge in investing is figuring out when stock prices have gotten ahead of reality. It’s a timely question given the excitement surrounding artificial intelligence and the strong rally we’ve seen in U.S. stocks over the past few years.
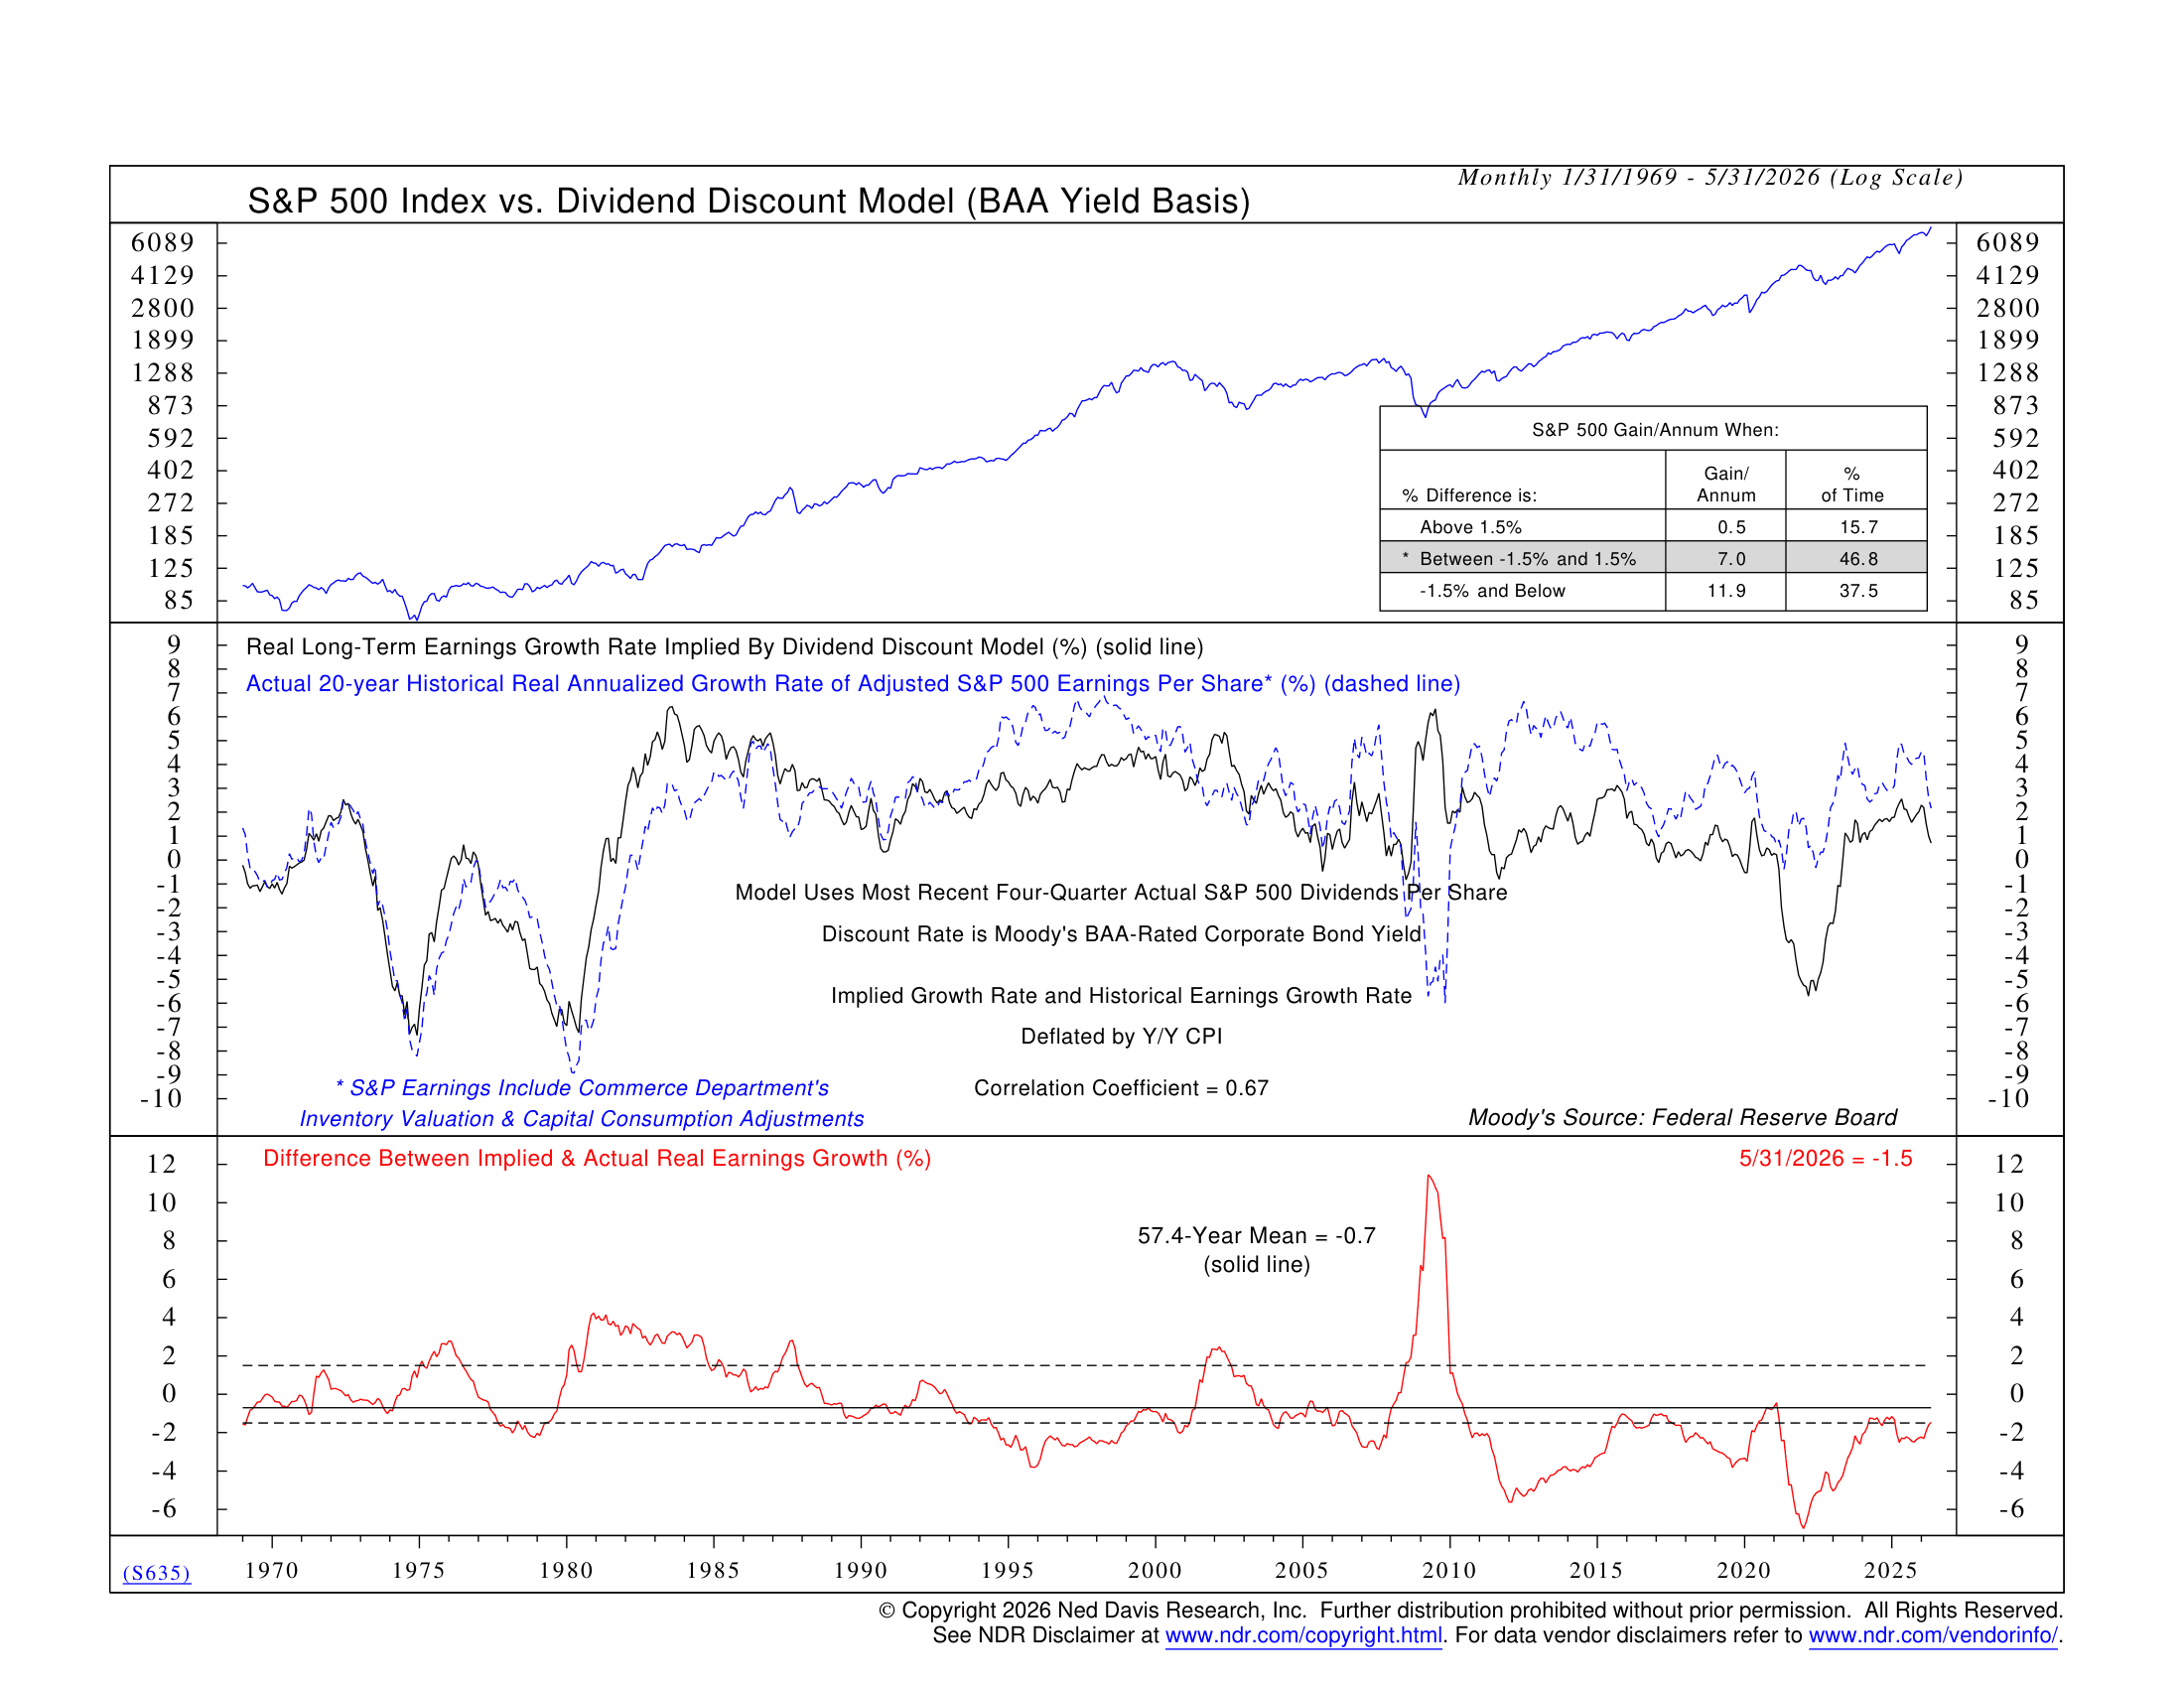
This week’s indicator approaches that question from a unique angle. Instead of asking whether stocks are “expensive” or “cheap,” it asks: How much earnings growth are investors already expecting?
To answer that question, it uses a financial model called the Dividend Discount Model. The model starts with today’s S&P 500 price, current dividend payments, and interest rates, then works backward to estimate the long-term earnings growth investors must be expecting to justify today’s stock prices. It then compares those expectations to the earnings growth companies actually delivered over the following 20 years during past market cycles.
The concept is fairly simple. When the market expects earnings growth that’s in line with—or even below—what companies have historically achieved, long-term returns have generally been favorable because investors aren’t demanding anything extraordinary.
On the other hand, when the market prices in much stronger earnings growth than history has delivered, future returns have tended to be more muted. After all, if investors have already assumed years of exceptional growth, companies have to work much harder just to meet expectations.
So what is the indicator telling us today?
Well, the current reading sits near -1.5%, meaning investors are expecting strong–but not too strong–long-term earnings growth than companies have typically delivered over history. That places the indicator right on the edge of its neutral zone. While that’s a step down from the more favorable readings we saw over the past year, it’s also worth noting that the indicator only recently moved out of its most bullish range.
In other words, the market has become more optimistic, but it hasn’t yet reached the kind of extreme optimism that has historically been associated with the weakest long-term returns.
The bottom line? Investors are clearly optimistic about the future, and much of that optimism is tied to AI’s potential to drive stronger earnings growth. The good news is that this indicator suggests those expectations, while high, haven’t yet reached the kind of extremes that have historically led to the weakest long-term returns. It’s a reminder that the market is expecting good things—but perhaps not quite as much as traditional valuation metrics would lead you to believe.
This is intended for informational purposes only and should not be used as the primary basis for an investment decision. Consult an advisor for your personal situation.
Indices mentioned are unmanaged, do not incur fees, and cannot be invested into directly.
Past performance does not guarantee future results.
The S&P 500 Index, or Standard & Poor’s 500 Index, is a market-capitalization-weighted index of 500 leading publicly traded companies in the U.S.