There are a lot of different variables out there that affect the stock market—more than you’d probably like to think about. But there are a handful that really drive stock performance, the ones investors make sure to pay close attention to.
Corporate profitability is one of them. How profitable are companies? How efficiently are they generating those profits? One of the best ways to track this is through a metric called Return on Equity, or ROE. It’s straightforward: take net income and divide it by shareholder equity. In simple terms, it measures how efficiently companies turn shareholder money into earnings.
Now, that’s all fine and dandy, but profits don’t exist in isolation. They have to compete for attention with interest rates—and that’s where this week’s indicator comes into play. It compares the S&P 500’s ROE to the yield on corporate bonds, showing how much more investors are earning by owning stocks instead of lending to companies.
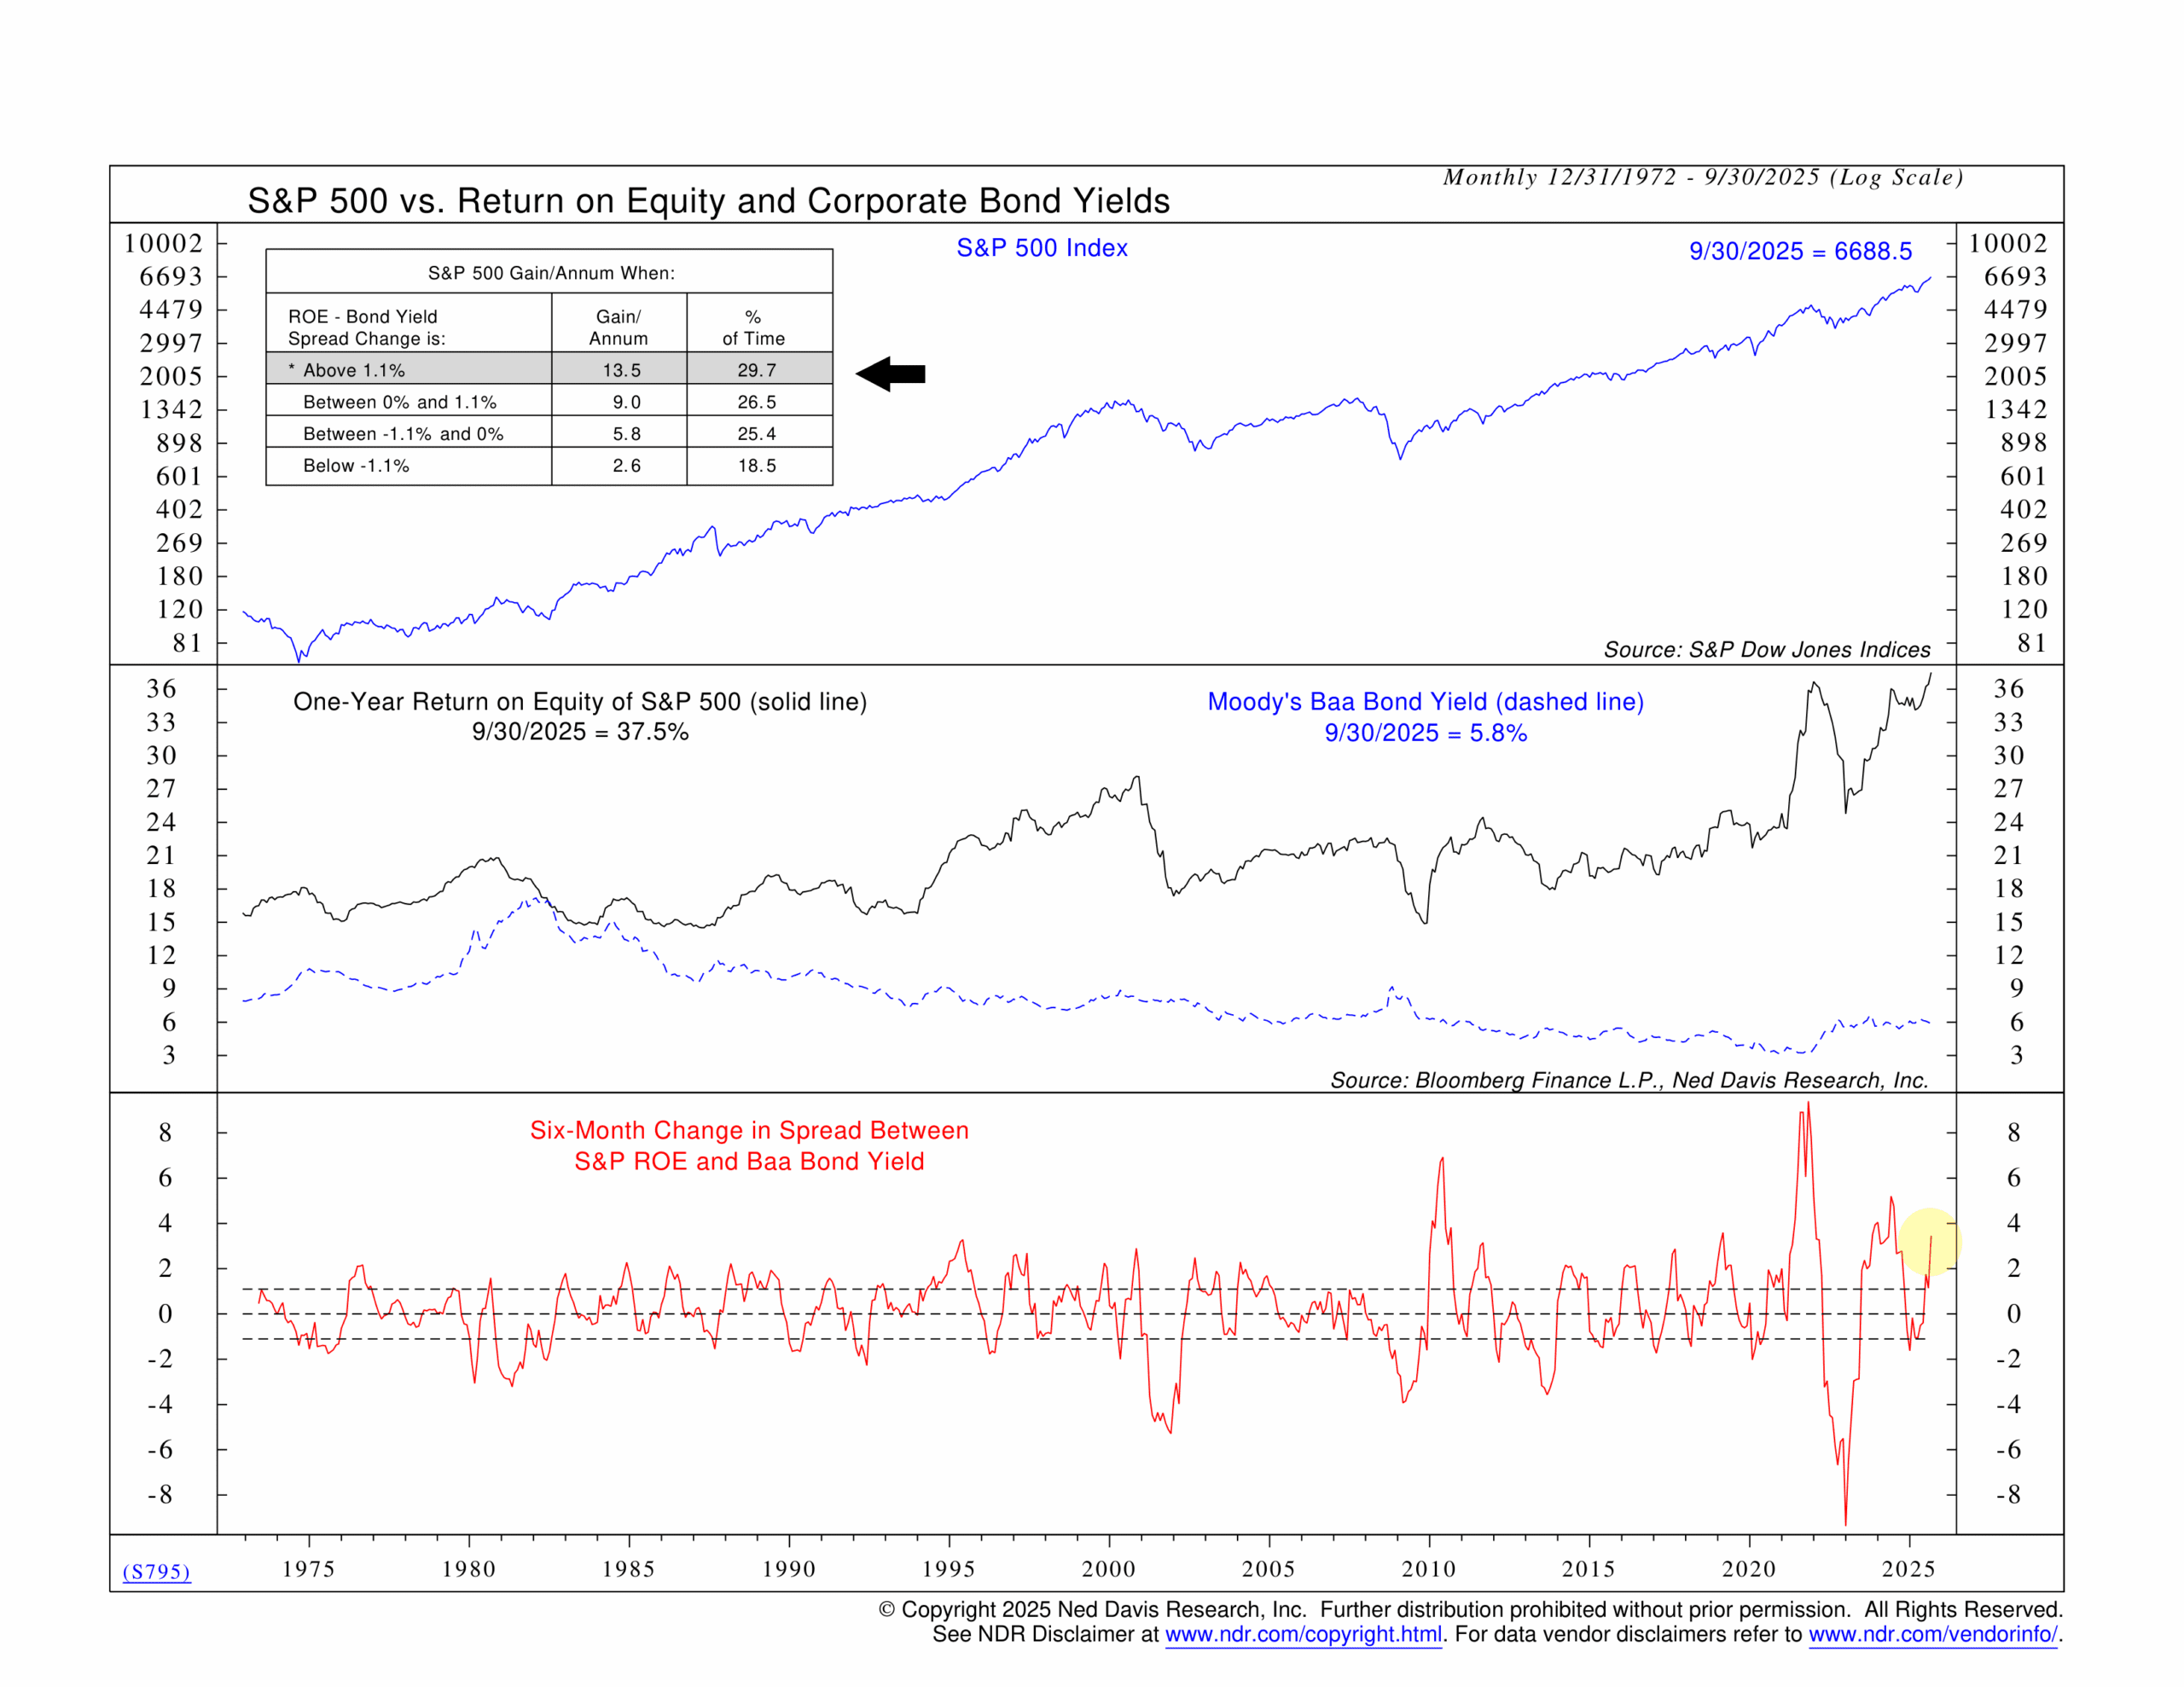
The chart is split into three parts. On top, we have the S&P 500 (the stock market). In the middle, the black line shows the one-year ROE for the S&P 500, while the blue dashed line tracks Moody’s Baa corporate bond yields—a measure of investment-grade debt with risk levels comparable to large-cap stocks. Finally, the lower panel shows the six-month change in the spread between ROE and the Baa bond yield.
That’s our indicator. Historically, when the spread has been wide—greater than 1.1%—the S&P 500 has delivered strong results, averaging roughly 13.5% per year. As that gap narrows, performance tends to fade. When the spread falls below -1.1%, average returns drop to just 2.6% annually.
Why does this work? Because the spread captures the tug-of-war between profitability and the cost of capital. When corporate profits comfortably outpace borrowing costs, investors are being rewarded for taking equity risk. When that advantage disappears, it means companies are losing some of their edge—either because rates are rising or margins are tightening.
Right now, the spread remains positive. The S&P 500’s ROE sits around 37.5%, compared to just under 6% on Baa-rated bonds. And the change in that spread has increased by nearly 4% over the past six months. Historically, that’s a really strong reading! And it suggests that S&P 500 companies have been especially efficient at generating profits these past 6 months, while borrowing costs have remained relatively flat.
The bottom line? The tug-of-war between ROE and corporate interest rates is an important one factor—one that investors sometimes forget about. That’s why this is the type of indicator that we like to use when we measure relative valuations in the stock market—and it’s a key component of that section of the model. When profitability wins that tug-of-war, it usually means the market still has the wind at its back.
This is intended for informational purposes only and should not be used as the primary basis for an investment decision. Consult an advisor for your personal situation.
Indices mentioned are unmanaged, do not incur fees, and cannot be invested into directly.
Past performance does not guarantee future results.
The S&P 500 Index, or Standard & Poor’s 500 Index, is a market-capitalization-weighted index of 500 leading publicly traded companies in the U.S.
The Moody’s Seasoned Baa Corporate Bond Yield Index measures the average yield on U.S. corporate bonds rated Baa by Moody’s Investors Service, representing medium-grade bonds with moderate credit risk.