Most people watch the stock market by looking at prices. Are they going up? Are they going down? But price is only one component. How do we know if that price is actually a good deal?
That’s where this week’s featured indicator comes into play. It measures something called the Real Earnings Yield. Specifically, it looks at how much companies in the S&P 500 are earning compared to their stock prices—and then subtracts inflation.
Why subtract inflation? Because it shows what’s left over after prices in the economy go up. Think of it like this: if you get a raise at work but the cost of groceries, gas, and rent all go up too, the raise doesn’t feel as big. The “real” number after inflation is what really matters.
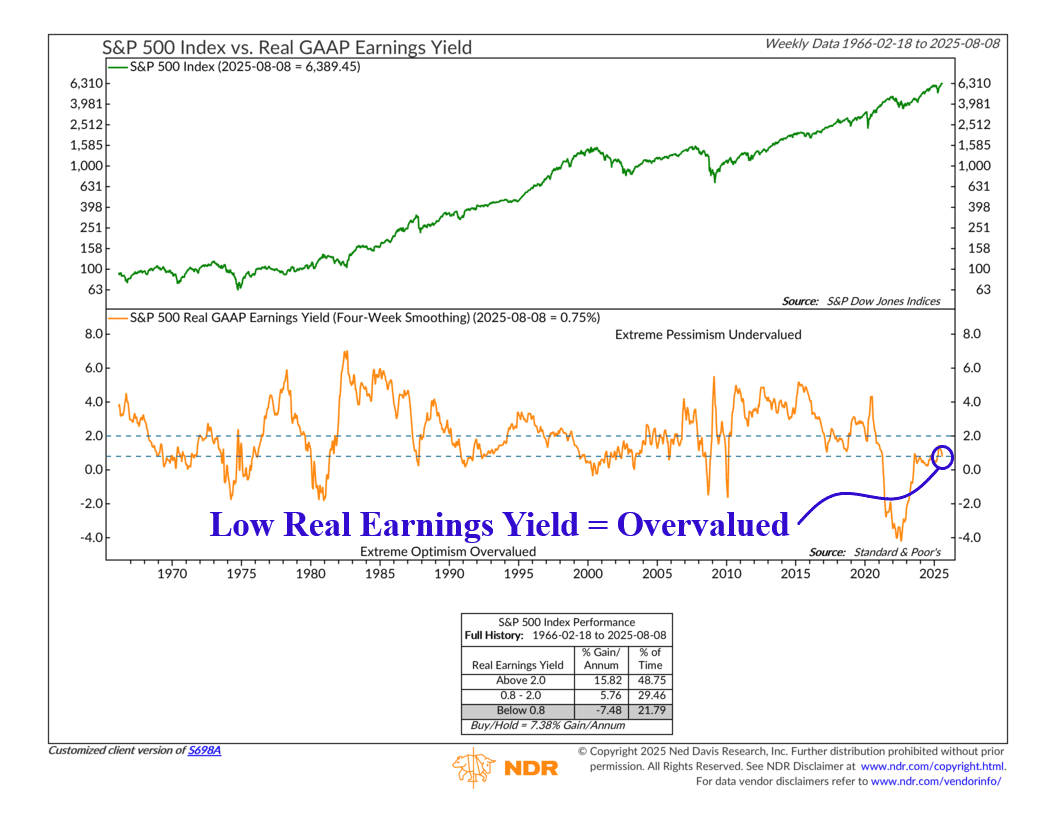
The chart has two parts. The top part shows the S&P 500 Index over time. The bottom part shows the real earnings yield going back to the 1960s. The dashed lines mark high (undervalued) and low (overvalued) levels. (Remember, we’re measuring the earnings yield here, which is the opposite of the P/E—price-to-earnings—ratio.) When the orange line is above the top dashed line, it means stocks are cheap compared to their inflation-adjusted earnings. Historically, that’s been a good time to own them. But when it’s below the bottom dashed line, stocks are expensive, and the market has usually had a harder time making gains.
As the performance box shows, since 1966, the S&P 500 has averaged over 15% a year when the real earnings yield was above 2%. When it was between 0.8% and 2%, the return was smaller—about 6% a year. And when it was below 0.8%, returns were actually negative, on average.
What’s the reading right now? About 0.75%—the lowest zone. In other words, stocks are looking expensive again relative to their inflation-adjusted earnings. Does that mean the market is going to tank tomorrow? Probably not. Almost assuredly not. But it does make the market more sensitive to bad news, like weaker earnings, higher inflation, or slower growth.
So when you hear someone talk about the market’s price, your first question should be, “relative to what?” This indicator helps answer that by weighing stock prices against earnings and inflation—what we call the real earnings yield. With the real earnings yield sitting this low, it makes sense to keep expectations in check. Of course, we’re not saying to dump stocks, but this is a reminder to stay mindful of risk. In an environment like this, a balanced portfolio and a steady, disciplined approach can make all the difference.
This is intended for informational purposes only and should not be used as the primary basis for an investment decision. Consult an advisor for your personal situation.
Indices mentioned are unmanaged, do not incur fees, and cannot be invested into directly.
Past performance does not guarantee future results.
The S&P 500 Index, or Standard & Poor’s 500 Index, is a market-capitalization-weighted index of 500 leading publicly traded companies in the U.S.