
Bonds. They’re kind of boring, right?
Well, at least compared to stocks, they can be.
Bonds rarely make headlines. They don’t have flashy earnings reports. And they don’t usually deliver the eye-popping returns that attract investors to the stock market.
But despite all this, bonds are incredibly important. They help determine borrowing costs throughout the economy, influence mortgage rates, and often provide stability when stock markets become volatile.
That’s why I think it’s important to understand what drives bond prices. And one of the more interesting ways we can gauge the bond market isn’t by looking at interest rates or inflation data directly, but by looking at what people are searching for online.
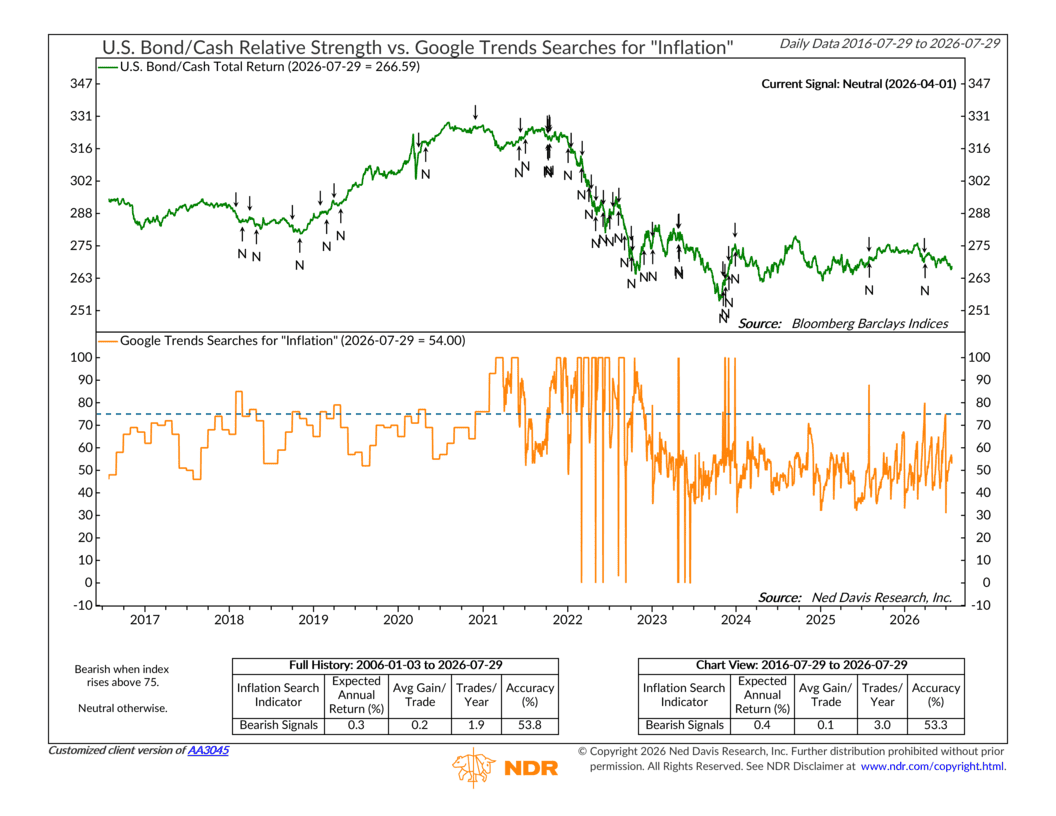
I know—that’s a little different from what we usually talk about around here. But this indicator tracks Google searches for the word “inflation.” Historically, when inflation suddenly becomes a popular search term, it often means consumers are becoming more concerned about rising prices. Those concerns frequently coincide with expectations for higher interest rates. And because bond prices and interest rates move in opposite directions, rising rate expectations have historically created a challenging environment for bonds.
Now, the model itself is straightforward. When inflation-related Google searches rise above a predetermined threshold (75 on the chart), the indicator turns bearish for bonds. When search activity remains below that level, the indicator stays neutral. We like it because it’s a unique way of measuring investor and consumer sentiment before those concerns are fully reflected in financial markets.
Today, the indicator sits in a neutral position. That’s good—certainly better than a few years ago when inflation was running hot and bond prices were falling sharply. But as you can see, we’ve still experienced a few brief spikes in inflation searches, most recently in April of this year. While those concerns haven’t been widespread enough to trigger a bearish signal, they do suggest that inflation hasn’t completely faded from people’s minds—or from the bond market’s.
Of course, we would never make an investment decision based on a single Google Trends chart. Instead, this indicator is one piece of our broader Weight of the Evidence approach. By combining multiple indicators together, we can objectively evaluate the evidence across the market and generate a disciplined, data-driven allocation recommendation.
It all gets to the heart of our investment philosophy: Individually, indicators can be noisy and weak. Together, they can be strong.
This is intended for informational purposes only and should not be used as the primary basis for an investment decision. Consult an advisor for your personal situation.
Indices mentioned are unmanaged, do not incur fees, and cannot be invested into directly.
Past performance does not guarantee future results.
The Bloomberg U.S. Aggregate Total Return Index (formerly the Barclays U.S. Aggregate Bond Index) is a broad, market-value-weighted index that tracks the performance of the U.S. investment-grade taxable bond market.
The Bloomberg U.S. Treasury Bills 3-Month Total Return Index measures the performance of U.S. Treasury bills with approximately three months remaining to maturity, including both price changes and interest income.