
With second-quarter earnings season just about wrapped up, I want to use this week’s indicator to look at something a little different than earnings: sales.
Why sales? Because earnings can be shaped by all sorts of things—cost cutting, buybacks, accounting decisions, one-time gains. Sales, on the other hand, are much harder to dress up. A company either sold more stuff than it did a year ago or it didn’t. That makes sales growth one of the cleaner ways to judge how healthy Corporate America really is.
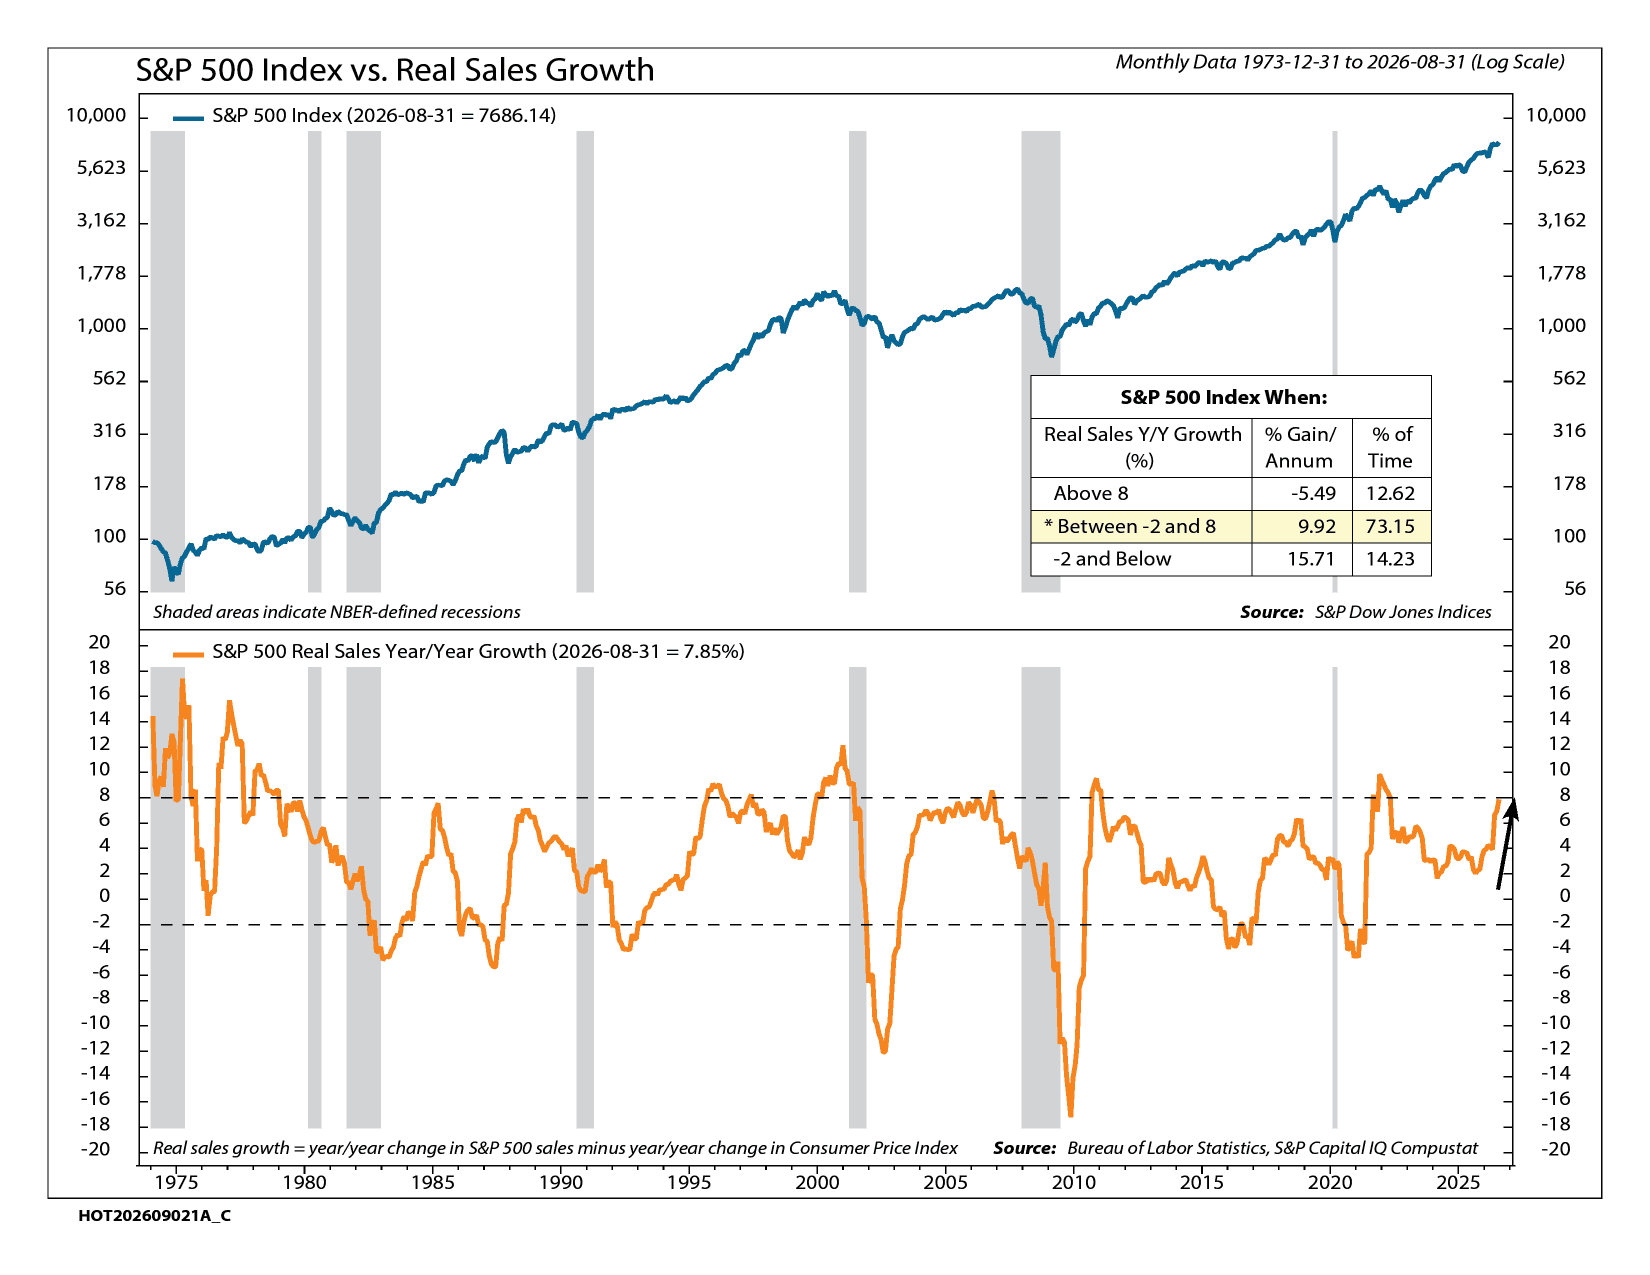
Here’s how it works. The bottom section of the chart above shows the year-over-year growth in S&P 500 sales after subtracting inflation. In other words, it strips out the portion of sales growth that comes simply from higher prices, leaving us with “real” sales growth. The dashed lines at 8% and -2% mark the zones that have mattered most historically.
Now, you might expect stronger sales growth to be good for stocks across the board. And most of the time, it is. But at the extremes, this indicator has actually worked in the opposite direction.
Going back to 1973, when real sales growth has been in the middle zone between -2% and 8%—which has been the case about 73% of the time—the S&P 500 has gained at a 9.9% annualized rate. When real sales growth has been below -2%, meaning companies are actually shrinking after inflation, the S&P 500 has done even better, rising at a 15.7% annualized rate. But when real sales growth has climbed above 8%, the S&P 500 has fallen at a 5.5% annualized rate.
That may seem backwards at first, but it makes sense when you think about it. When sales are shrinking, expectations are low and the economy is usually near a bottom, so there’s plenty of room for improvement. When sales are growing at an unusually fast clip, the opposite is true. Growth that strong is hard to sustain, and the market has often already priced in the good news. Investors end up paying for a pace of growth that eventually slows down.
So where does the indicator stand today? As of the end of August, real S&P 500 sales growth sits at 7.85%. That is the fastest pace since 2022, and it puts the indicator right up against the 8% threshold that has historically marked “too much of a good thing.”
To be clear, this is not a bearish signal yet. The indicator is still in its neutral zone, and even if it crosses above 8%, that would not automatically mean a downturn is coming. There have been stretches—the late 1990s, for example—where sales growth ran hot for a while and stocks kept climbing.
But it does tell us something about where we are in the cycle. Right now, the good news is very good. Sales are surging, profit margins are at record highs, and companies are beating estimates at one of the highest rates on record. The question this indicator asks is whether that pace can continue—and history suggests that when growth gets this strong, the risk shifts from “will things get better?” to “can things stay this good?”
The bottom line? Strong sales growth is a great problem to have. But when it approaches levels that have rarely been sustained, it’s worth remembering that the stock market tends to care less about how good things are today and more about how they compare to what comes next.
This is intended for informational purposes only and should not be used as the primary basis for an investment decision. Consult an advisor for your personal situation.
Indices mentioned are unmanaged, do not incur fees, and cannot be invested into directly.
Past performance does not guarantee future results.
The S&P 500 Index, or Standard & Poor’s 500 Index, is a market-capitalization-weighted index of 500 leading publicly traded companies in the U.S.