
For this week’s indicator, I want to talk about market leadership.
We tend to think about the stock market as one big thing. Either stocks are going up or stocks are going down. But underneath the surface, there is almost always a battle taking place between different areas of the market.
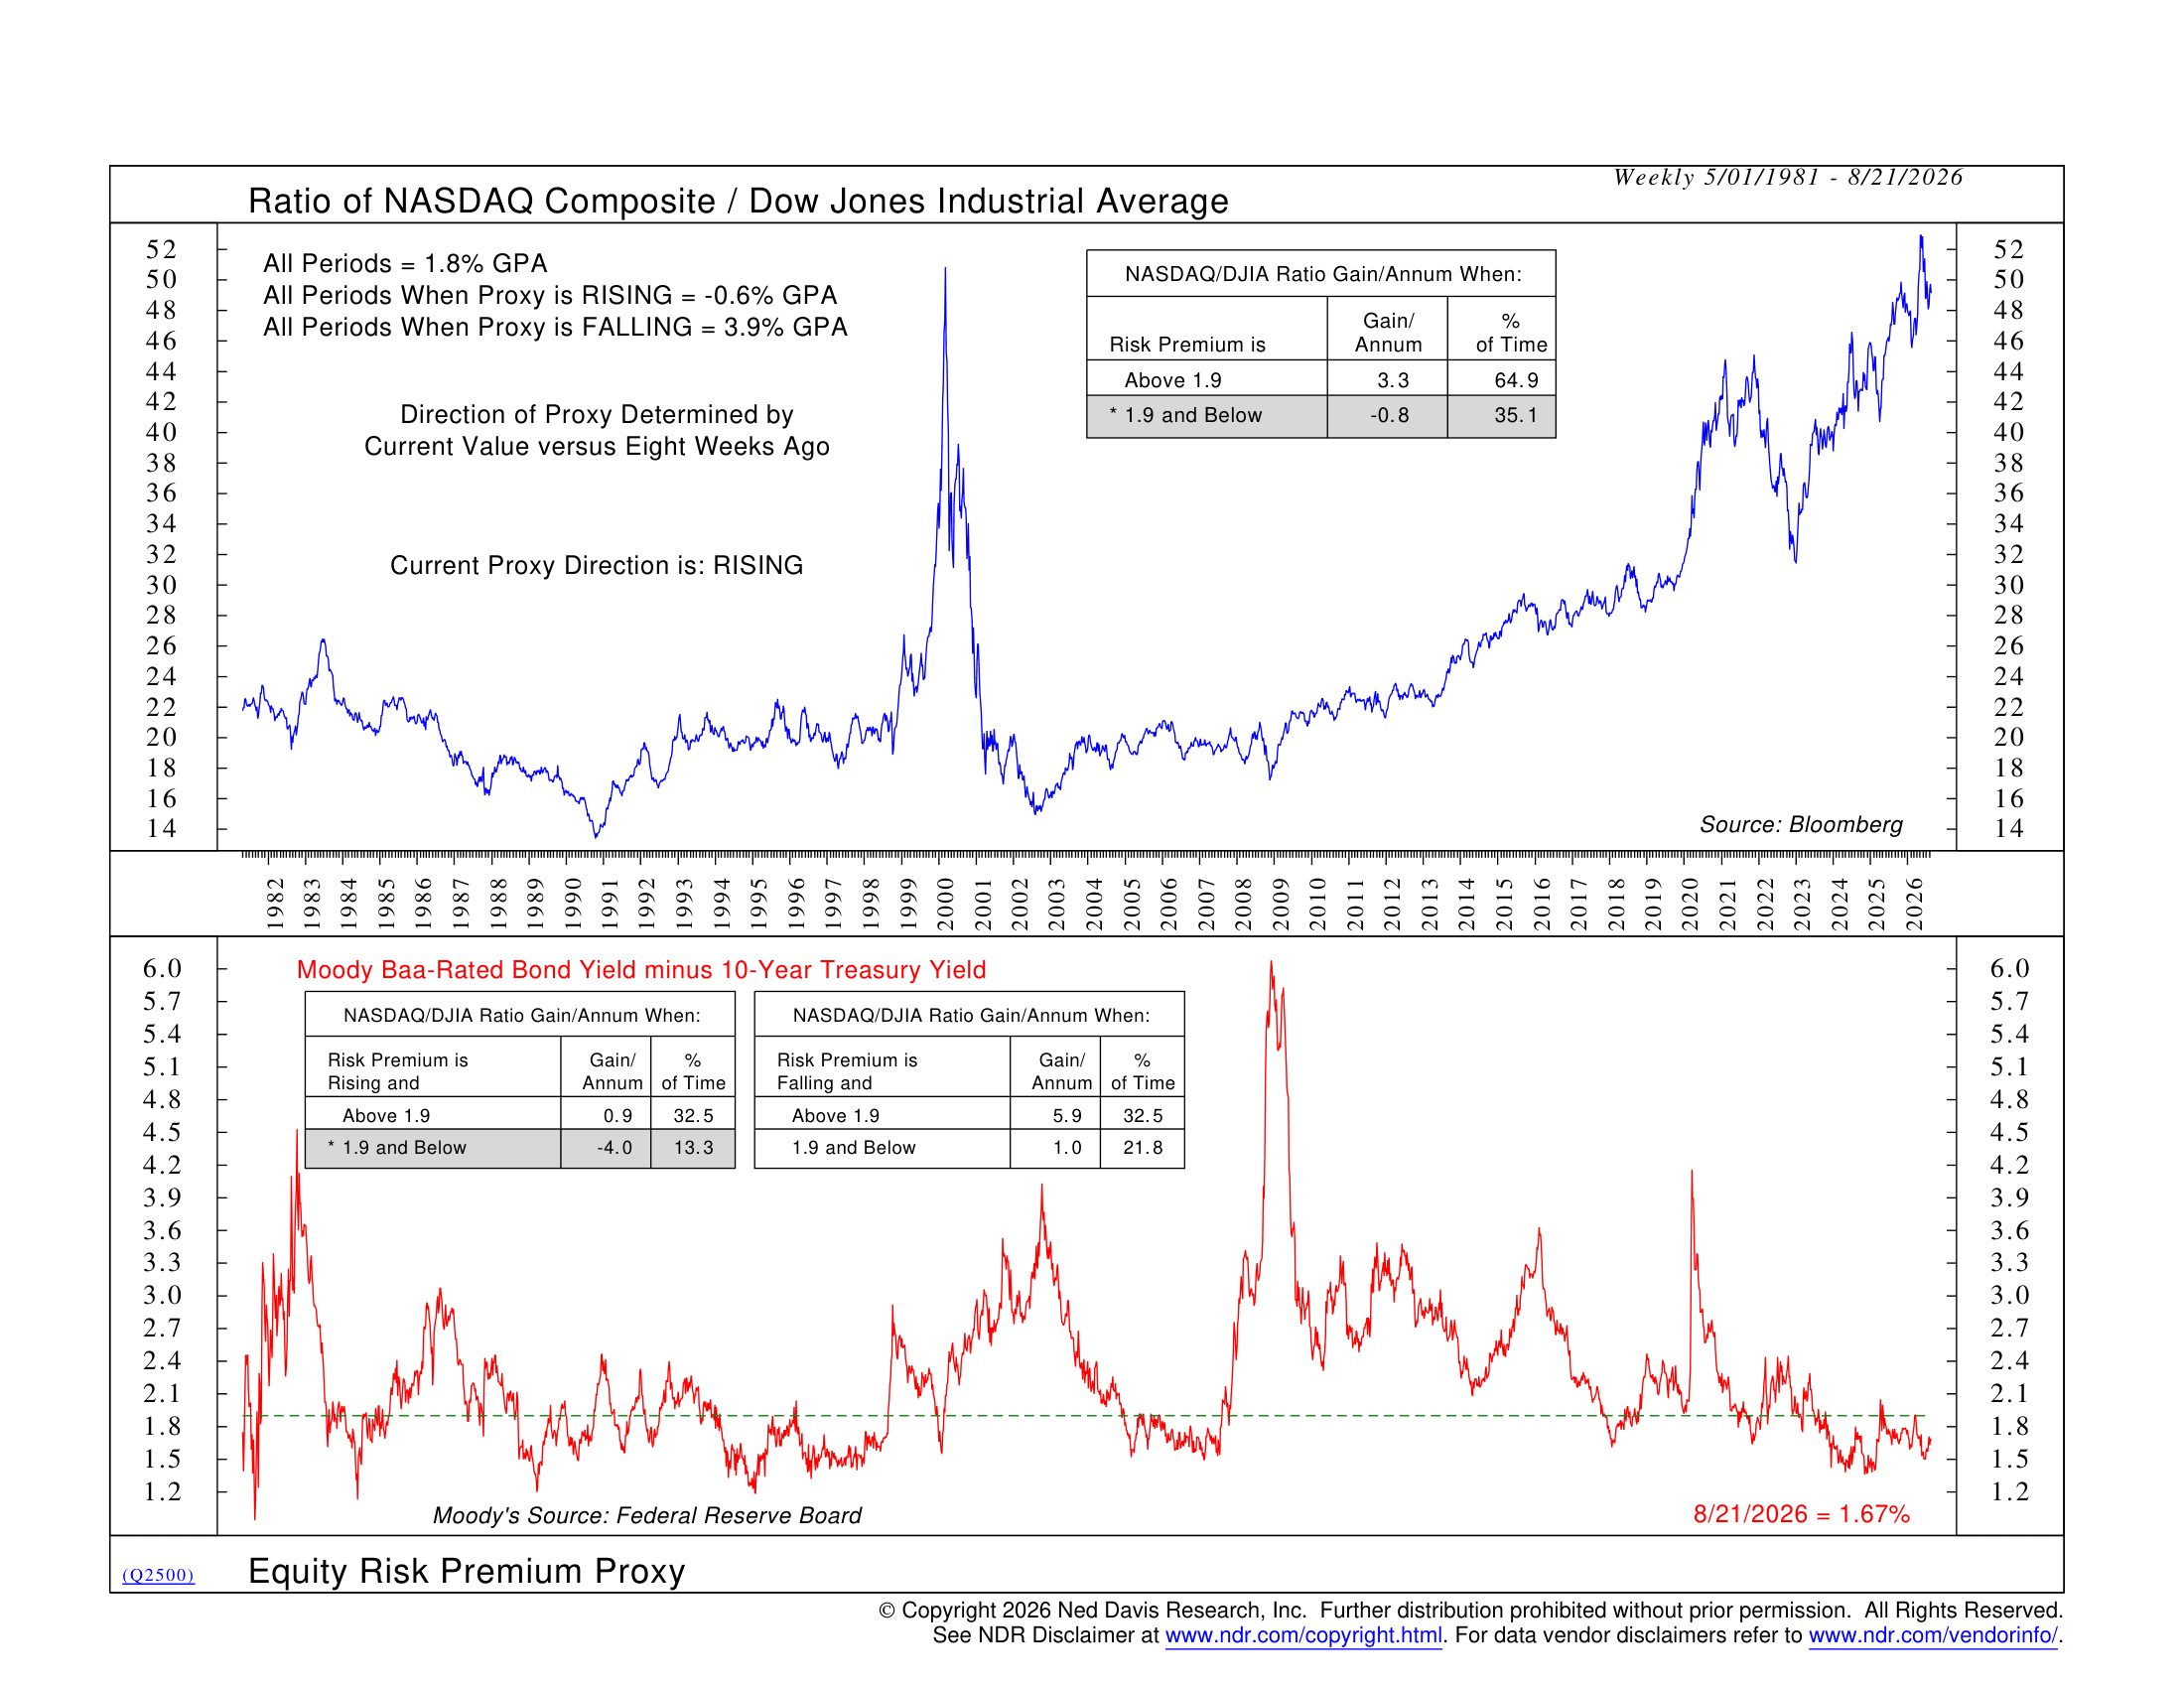
This indicator looks at one of those battles by comparing the NASDAQ Composite to the Dow Jones Industrial Average. When the line in the top clip is rising, the NASDAQ is outperforming the Dow. When it is falling, the Dow is coming out ahead.
But the more interesting part of the indicator is what is driving that relationship.
The bottom clip measures the difference between the yield on lower-quality investment-grade corporate bonds and the 10-Year Treasury yield. Basically, it tells us how much extra yield investors are demanding to own corporate bonds instead of safer Treasury bonds.
That spread can tell us something about investors’ appetite for risk. When investors are comfortable taking risk, the spread tends to be relatively low. When concerns start to build, investors demand more compensation and the spread begins to rise.
And historically, that has mattered for stock market leadership.
When the spread has been above 1.9% and falling, the NASDAQ has outperformed the Dow at a 5.9% annualized rate. But when the spread has been below 1.9% and rising, the relationship flips. In those periods, the NASDAQ/Dow ratio has fallen at a 4.0% annualized rate.
That second scenario is where we find ourselves today.
The spread currently sits at about 1.67%, so it remains relatively low. But importantly, it has been rising over the past eight weeks. That puts the indicator into the historical zone that has been the least favorable for NASDAQ leadership.
Honestly, that makes some intuitive sense. A low spread tells us financial conditions are still fairly healthy. But a rising spread tells us they are moving in the wrong direction. Investors may not be running for the exits, but they are beginning to demand a little more compensation for taking risk.
And when that happens, some of the more aggressive areas of the stock market have historically had a harder time maintaining their leadership.
Now, none of this means the NASDAQ is destined to fall or that the Dow has to outperform from here. Like most indicators we follow, this is not meant to be a stand-alone timing signal.
Instead, it gives us another way to judge what is happening beneath the major indexes. And right now, the bond market is sending a small warning that the type of market leadership investors have grown accustomed to may be getting a little harder to sustain.
This is intended for informational purposes only and should not be used as the primary basis for an investment decision. Consult an advisor for your personal situation.
Indices mentioned are unmanaged, do not incur fees, and cannot be invested into directly.
Past performance does not guarantee future results.
The Dow Jones Industrial Average (DJIA) is a price-weighted index composed of 30 widely traded blue-chip U.S. common stocks.
The Nasdaq 100 Index is a basket of the 100 largest, most actively traded U.S. companies listed on the Nasdaq stock exchange. The index includes companies from various industries except for the financial industry, like commercial and investment banks.