This week’s featured indicator aims to stay in harmony with the stock market’s long-term trend.
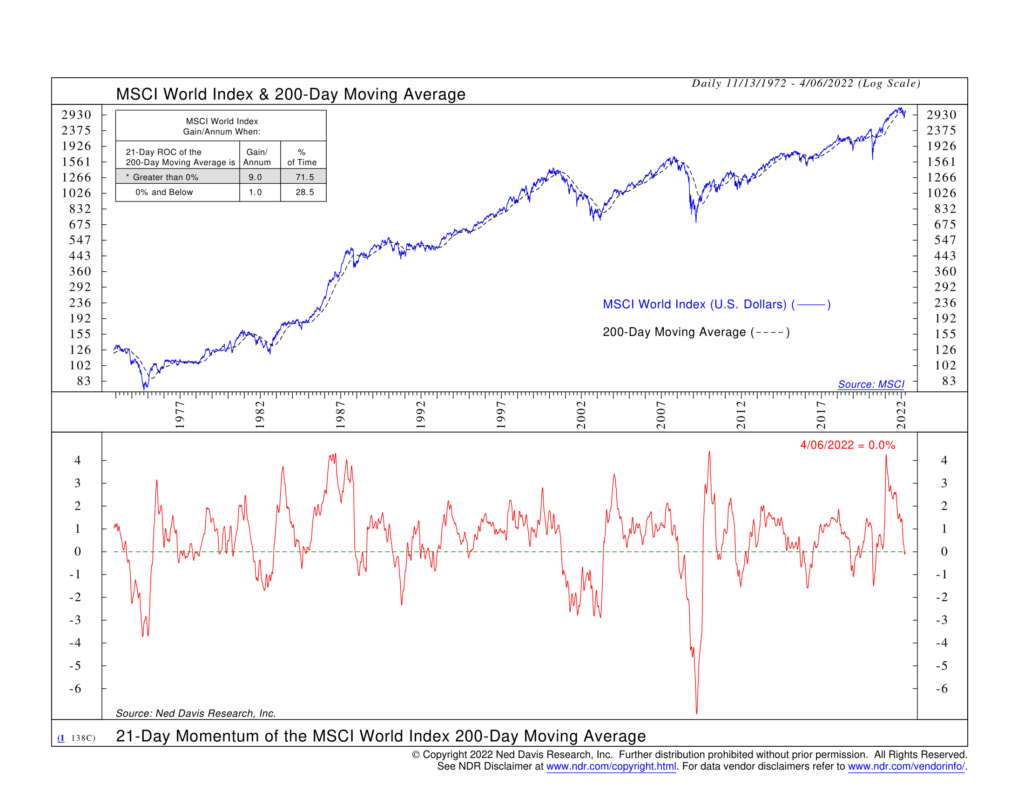
To do this, the indicator first calculates the 200-day moving average of the MSCI World stock market index. The MSCI World Index (priced in U.S. dollars) is used as a proxy for global stocks, and it’s shown as the blue line on the chart above. The black line is its 200-day moving average or average price over the past 200 trading days.
In the financial world, the 200-day moving average is generally considered a good representation of the market’s long-term trend. If it’s going up, that’s a good thing; falling, and that isn’t so good.
But we can do better than that. This indicator also takes the 21-day change (or monthly momentum) of the 200-day moving average. This is shown as the red line on the chart. By taking the monthly change of the long-term global stock price trend, we get a more accurate signal of where the market is trying to go.
As the performance box shows, when the 21-day momentum of the 200-day moving average of global stock returns is greater than zero (i.e., the red line is above the green dashed line), the MSCI World Index has returned 9% per year on average. However, when the momentum measure falls below zero, the MSCI World Index has only returned 1% per year.
This is compelling evidence that global stock price momentum matters to long-run stock returns. Once the stock market’s long-term trend starts to pick up or lose steam, it will generally continue down that path for some time. In other words, a stock market in motion stays in motion. And in general, we want to keep in harmony with this motion as much as possible.
This is intended for informational purposes only and should not be used as the primary basis for an investment decision. Consult an advisor for your personal situation.
Indices mentioned are unmanaged, do not incur fees, and cannot be invested into directly.
Past performance does not guarantee future results.