Markets don’t go up forever. Occasionally, they hit a wall. Recently, the U.S. stock market has done just that, leaving many investors wondering: is momentum slowing down? Just how overbought was the market? Is a larger downturn coming? This week’s featured indicator, the S&P 500 9-Month Stochastic, can help answer those questions.
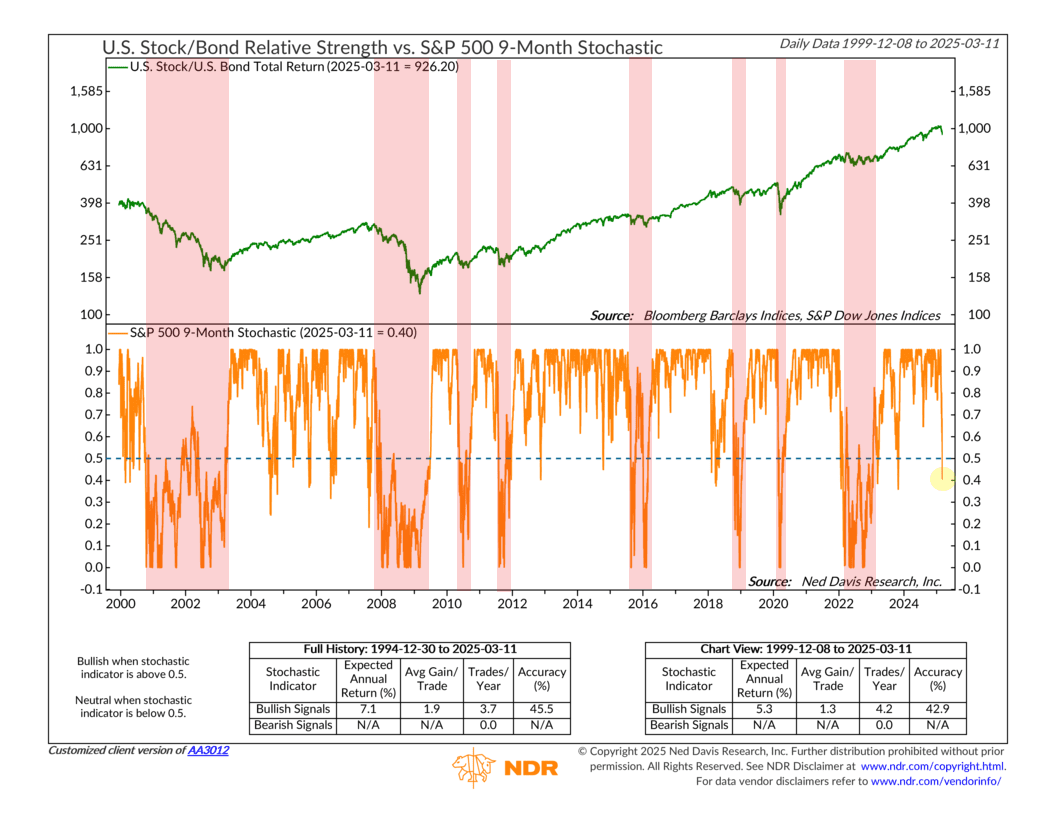
For starters, the chart above tracks two key metrics: the relative strength of U.S. stocks versus bonds (top panel) and the 9-month stochastic reading of the S&P 500 (bottom panel in orange). This stochastic metric measures how stretched the market is relative to recent price trends. Readings above 0.5 indicate bullish momentum, while readings below 0.5 suggest the market is cooling off.
Historically, when this stochastic measure falls below 0.5, it signals that stocks are losing steam after an extended run. More importantly, when it drops below 0.2, it has coincided with major sell-offs. Looking at the red-shaded areas on the chart, you can see that market recoveries didn’t begin until the stochastic bottomed out and started moving higher again.
Where are we now? As you can see, the stochastic sits at 0.40, meaning the market has started to come off recent highs. The key question: will we see a quick rebound like in 2023, or will stocks sink further into deeper oversold territory? If the stochastic continues to decline toward 0.2 or lower, history suggests the risk of a more significant sell-off rises.
The table at the bottom of the chart backs this up. When the stochastic is above 0.5, the market has historically posted solid returns. But when it drops lower, performance weakens—and if it plunges near 0.2, deeper corrections have often followed.
So, the bottom line is that while this indicator doesn’t guarantee market direction, it has been a reliable warning sign in the past. If stocks fail to stabilize soon, investors should be prepared for the possibility of even more volatility ahead.
We’ll be watching to see if this turns into just a minor reset—or something bigger.
This is intended for informational purposes only and should not be used as the primary basis for an investment decision. Consult an advisor for your personal situation.
Indices mentioned are unmanaged, do not incur fees, and cannot be invested into directly.
Past performance does not guarantee future results.
The S&P 500 Index, or Standard & Poor’s 500 Index, is a market-capitalization-weighted index of 500 leading publicly traded companies in the U.S.