This week’s featured indicator is all about expectations. The stock market runs on expectations. It anticipates what is going to happen in the future and then prices it in today. That’s why surprises in economic data matter so much. Surprises move markets.
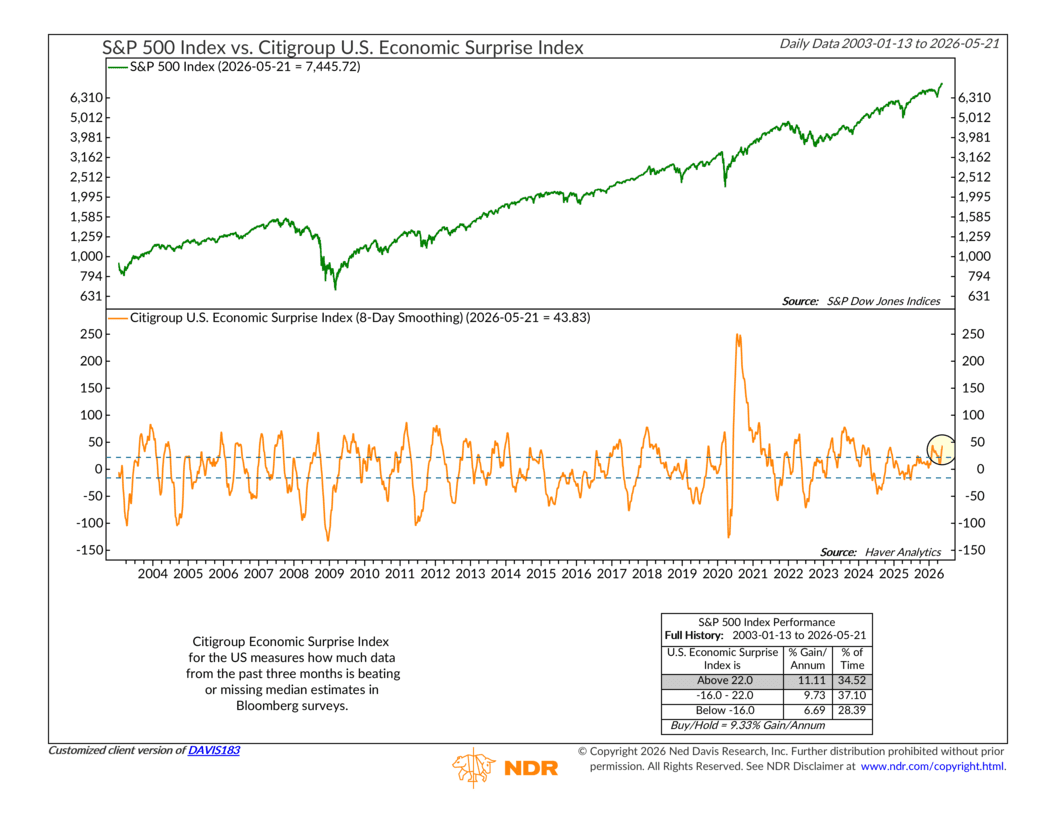
Here’s how it works. On the top clip of the chart above, we have our standard proxy for the stock market, the S&P 500 Index. On the bottom, we have the Citigroup U.S. Economic Surprise Index (smoothed over 8 days). This metric measures how much economic data from the past three months has been beating or missing the median estimates in Bloomberg surveys. In other words, it captures the gap between the economy and the consensus view of it.
We track the indicator against the S&P 500 across three zones: above 22.0, between -16.0 and 22.0, and below -16.0. The signals and subsequent S&P 500 returns are fairly straightforward. When the index is above 22, economic data is coming in stronger than expected, and the S&P 500 has historically performed the best, returning about 11.11% per year. In between the brackets, data is generally coming in as expected, and returns are more average at around 9.73% annually. And when the index falls below -16%, the data is surprising to the downside, which has historically led to weaker S&P 500 returns of less than 7% annually.
The good news? The most recent reading for the indicator came in just under 43. That’s well into “positive surprise” territory. Despite everything going on in the world and here at home, economic data continues to catch experts offsides and surprise to the upside.
Overall, this is an important indicator to highlight right now because it’s one of the components within the Economic Activity sub-composite of our Economic Data model. It’s also one of the few indicators in the broader model currently on Buy, while many of the economic and investor behavior signals remain more cautious. For now, the message is simple: the economy continues to perform better than expected, and the market has historically rewarded that kind of resilience.
This is intended for informational purposes only and should not be used as the primary basis for an investment decision. Consult an advisor for your personal situation.
Indices mentioned are unmanaged, do not incur fees, and cannot be invested into directly.
Past performance does not guarantee future results.
The S&P 500 Index, or Standard & Poor’s 500 Index, is a market-capitalization-weighted index of 500 leading publicly traded companies in the U.S.