A lot of stuff in the financial world has to do with expectations.
The stock market, for example, is based on expectations. It’s a forward-looking mechanism. This means that the price of stocks today reflects—among other things—what investors anticipate the economic environment will look like in the foreseeable future.
When a specific economic data point is released, then, whether it is good for the stock market depends on whether it beats expectations.
There are many ways to measure expectations, but one way is to survey professional analysts.
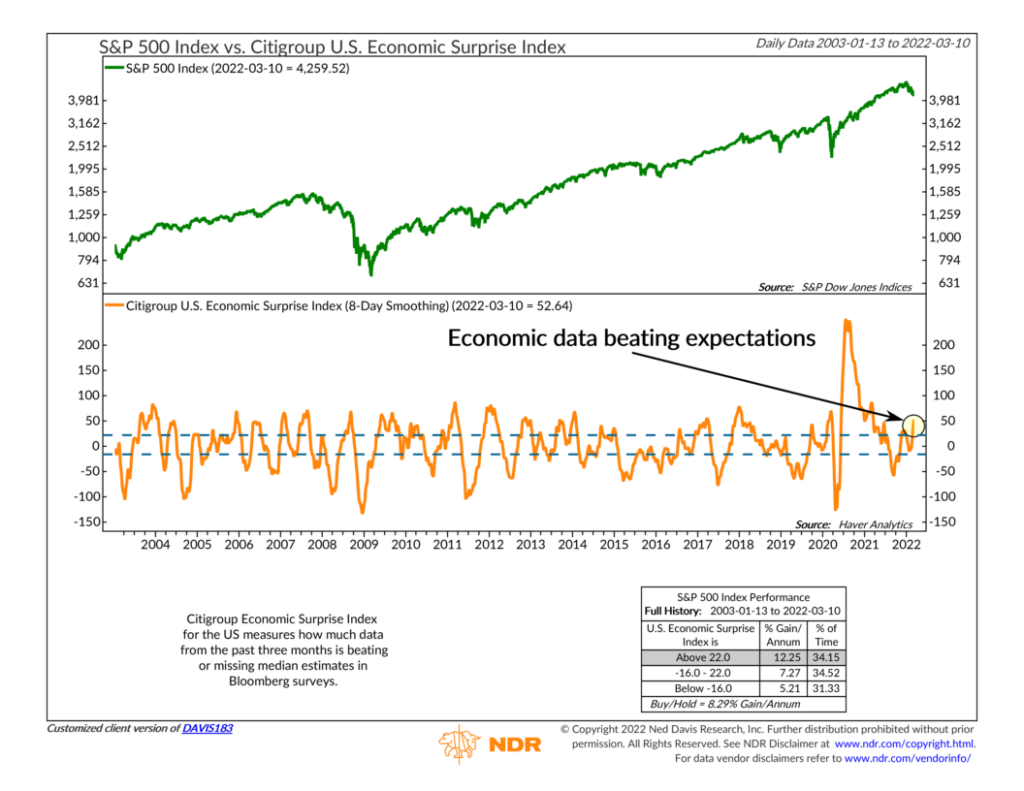
The Citigroup Economic Surprise Index does just that by measuring how much data from the past three months is beating or missing the median estimates in Bloomberg surveys. Stated differently, it measures the pace at which economic indicators are coming in ahead of or below expectations.
We show the 8-day rolling average of the Citigroup Economic Surprise Index (orange line) in the bottom clip of the chart above. A rising line means economic data are beating expectations to a greater extent. A falling line means the opposite.
As you can see, it fluctuates pretty regularly, spending roughly an equal amount of time in each of the three zones demarked by the upper and lower dashed lines.
When the Economic Surprise Index is above the upper dashed line, the S&P 500 stock market index (green line, top clip) performs the best, returning roughly 12.3% per annum, on average.
Returns are more average between the lines—about 7.3% per annum.
But when the index is below the lower dashed line, S&P 500 returns are below average—around 5.2% per annum.
This indicator is relevant today because it has recently crept back up into a bullish zone and is the highest since the first quarter of last year.
There hasn’t been a whole lot of good news lately for investors. But, from an economic perspective, the U.S. economy does appear to still be on a solid footing.
Last week, we found out that 678,000 net new jobs were created in February, beating Wall Street’s expectations by roughly 238,000.
That is the kind of expectation-beating data that pulls the Economic Surprise Index higher.
And according to our indicator, the bigger the surprise, the better it is for prospective stock market returns.
This is intended for informational purposes only and should not be used as the primary basis for an investment decision. Consult an advisor for your personal situation.
Indices mentioned are unmanaged, do not incur fees, and cannot be invested into directly.
Past performance does not guarantee future results.