
This week’s indicator kind of reminds me of the temperature gauge on your car. Most of the time, we never really pay attention to it. The needle just kind of sits there right in the middle, and we go on with our drive.
But every now and then, the needle starts to creep up. Nothing is necessarily wrong yet. There’s no warning light and no steam coming from under the hood. But still, you might find yourself glancing down at it a lot more often than you did ten minutes ago.
Or, maybe you just ignore it completely? But the point of this week’s indicator is that we don’t want to ignore the early warning signs, because it might cost us down the road.
So, let’s take a look. This specific indicator works a lot like that temperature gauge—only it’s measuring inflation.
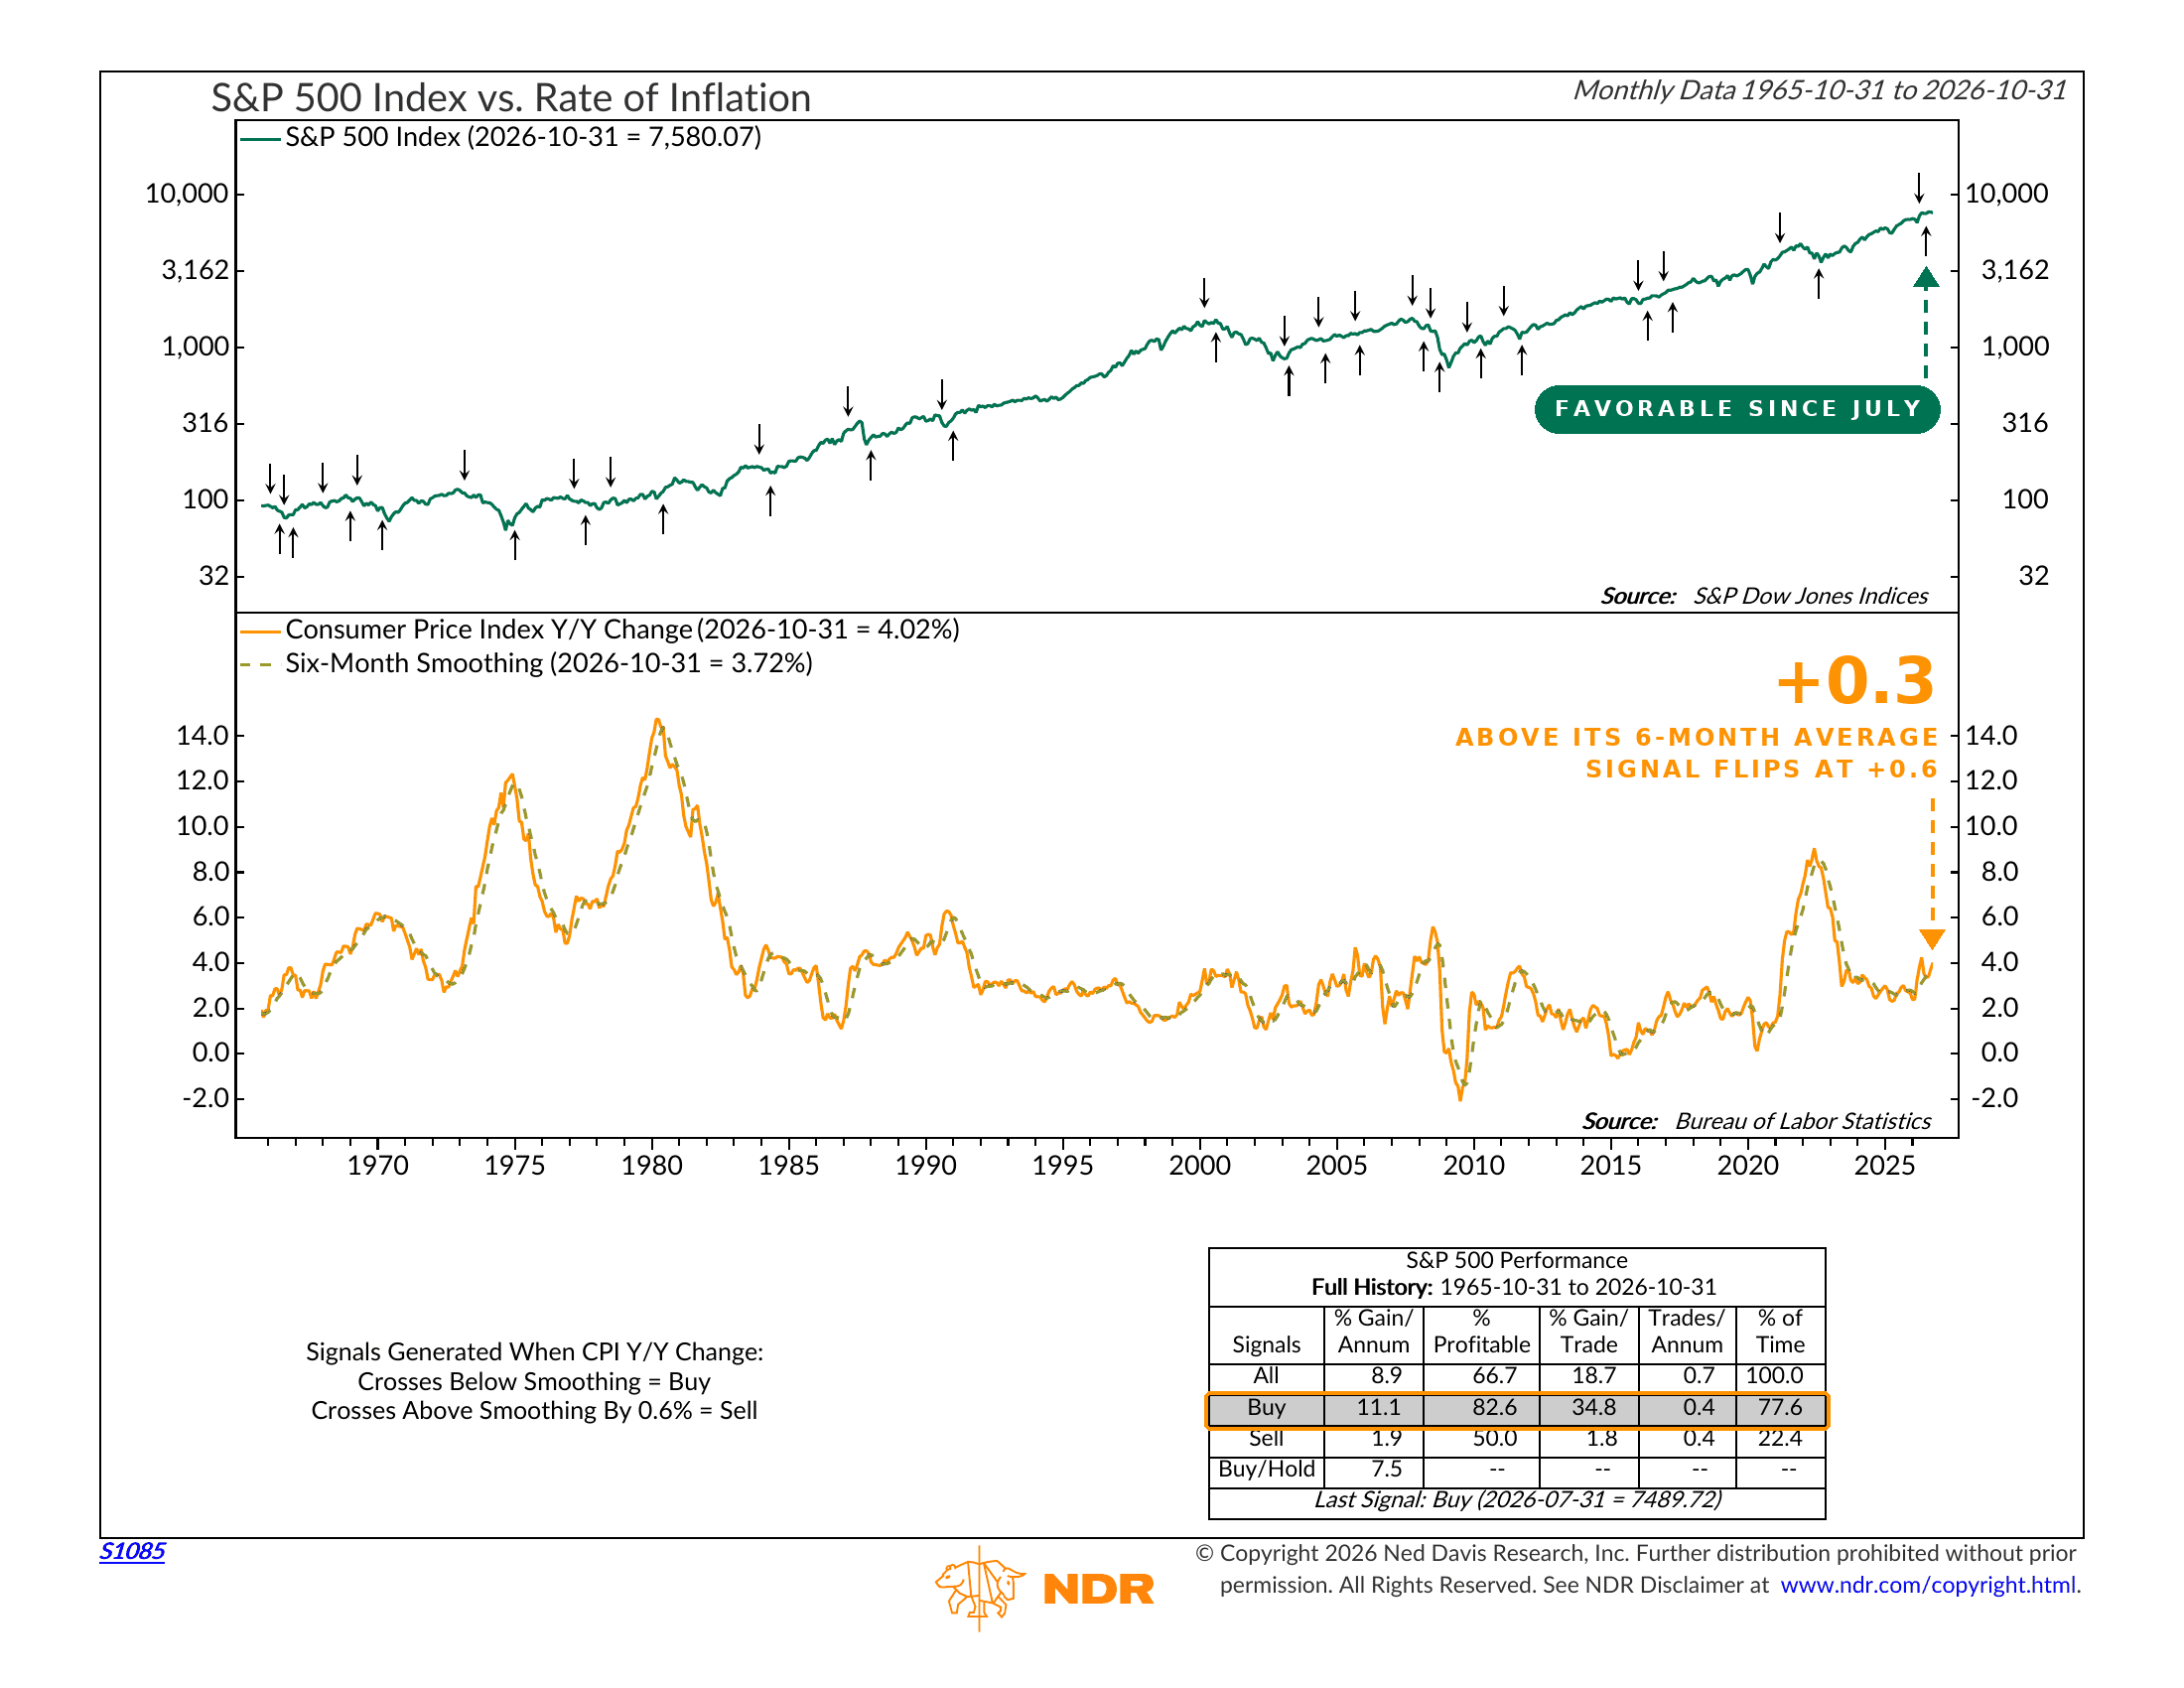
Here’s how it works. The top half of the chart shows the S&P 500 Index going back to 1965. The solid line in the bottom half is the inflation rate, or how much consumer prices have gone up over the past year. The dashed line is its six-month average. Think of the dashed line as the spot where the temperature needle normally sits, the normal range.
What the indicator watches is the gap between the two. When inflation drops below its six-month average, it generally means price pressures are cooling off. That has been a favorable signal for stocks. However, when inflation climbs above that average by more than 0.6 percentage points, that’s like saying the engine is running hot, and the signal actually flips to negative for stocks.
Ok, but why exactly would that matter for stocks? Well, rising inflation tends to push interest rates higher, and higher rates make it more expensive for businesses and families to borrow and spend.
The performance history of this indicator makes it more clear. Since 1965, the S&P 500 has gained about 11.1% a year while the indicator was on its favorable signal. That has been the case pretty much three-quarters of the time. But on the warning signal, the gain drops to just 1.9% a year. And simply holding the index the whole way through returned about 7.5% a year.
So where are we now? The indicator actually flashed a warning earlier this year. Then inflation cooled off over the summer, and the signal moved back to favorable at the end of July.
Since then, though, the needle has started to climb again. The last three monthly inflation reports have all come in on the hot side, and the inflation rate is now sitting right around 4%. Its six-month average is closer to 3.7%. That puts the gap at about 0.3 percentage points—roughly halfway to the line where the signal would flip back to bearish (negative).
Now, I would give a word of caution. This gauge has a history of false alarms. Stocks ended up higher during about half of its past warning periods, so a flip doesn’t mean trouble is necessarily guaranteed. It also only updates once a month, and a single cooler report could send the needle right back toward the middle. That’s pretty much what happened this summer.
The bottom line? The warning light is still off. But inflation has started to heat up again, and it wouldn’t take much more to tip this indicator over. This is probably something to keep an eye on since inflation has been such a scourge for the stock market and the economy the past few years.
This is intended for informational purposes only and should not be used as the primary basis for an investment decision. Consult an advisor for your personal situation.
Indices mentioned are unmanaged, do not incur fees, and cannot be invested into directly.
Past performance does not guarantee future results.
The S&P 500 Index, or Standard & Poor’s 500 Index, is a market-capitalization-weighted index of 500 leading publicly traded companies in the U.S.
The Consumer Price Index, or CPI, is a measure of the average change over time in the prices paid by consumers for a basket of goods and services.