This week’s indicator is all about central banks. What are central banks? They’re like the “money boss” of a country. They decide how much money should be in circulation and set interest rates to help maintain price stability. It’s the setting of interest rates that is the focus of this week’s indicator.
But first, some definitions. When a central bank lowers interest rates, it’s called “expansionary” or “loose” monetary policy. Some refer to it as “easing.” Lower rates make borrowing cheaper, which tends to stimulate economic growth and encourage risk-taking. On the other hand, when a central bank raises rates, it’s called “contractionary” or “tight” monetary policy, since higher borrowing costs usually slow the economy down.
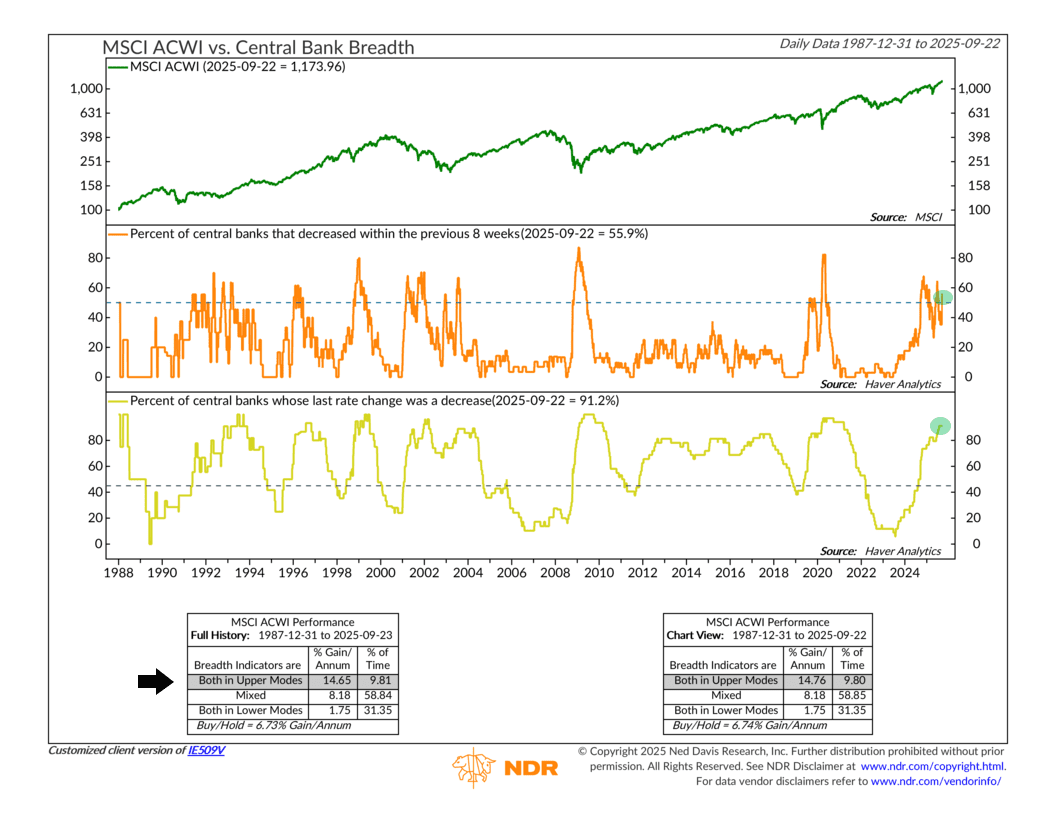
This indicator connects those policy shifts to the stock market. At the top of the chart, we see the MSCI ACWI, a benchmark for global stock market returns. The next two panels track what we call central bank breadth. The middle panel shows the percentage of central banks that have cut rates within the last eight weeks, while the bottom panel shows the percentage whose most recent move was a rate cut. Basically, it’s measuring just how expansionary monetary policy around the world is.
Pretty straightforward. But here’s the key: the performance box at the bottom shows that when both measures are in their upper bullish modes, global stocks have historically performed the best. In other words, the most favorable time for stocks is when a majority of central banks are cutting rates—and doing so recently.
In the mixed zone, when only one of the measures is bullish, stocks still tend to do well, though not quite as well. And when neither measure is bullish—meaning central banks are largely tightening—stocks have historically posted the weakest results.
For example, recent history makes for an interesting case study. At the start of the year, a large share of central banks’ last move was a rate cut (bottom panel), but the middle panel shows that many had paused their easing cycles, including the U.S. By April, only about 40% of central banks had cut rates in the prior eight weeks, and sure enough, global stocks wobbled.
Fast forward to today, however, and the picture looks very different. Roughly 91% of central banks’ last move was a rate cut, and about 56% have cut rates in just the past eight weeks. According to this indicator, that’s a very bullish setup for global stocks.
So, the bottom line is that central banks play a massive role in shaping the investment landscape, and this indicator shows how powerful their collective influence can be. History suggests that when central banks are easing in unison, markets tend to respond favorably. Right now, breadth is firmly in bullish territory, so the weight of monetary policy is leaning in investors’ favor.
This is intended for informational purposes only and should not be used as the primary basis for an investment decision. Consult an advisor for your personal situation.
Indices mentioned are unmanaged, do not incur fees, and cannot be invested into directly.
Past performance does not guarantee future results.
The MSCI ACWI captures large and mid cap representation across 23 Developed Markets and 24 Emerging Markets countries. With 2,935 constituents, the index covers approximately 85% of the global investable equity opportunity set.