After nearly 2 ½ years, we finally experienced a global breadth thrust last week.
What’s a global breadth thrust? Well, it basically means a whole bunch of stocks around the world moved significantly higher at the same time—and in a relatively short period of time.
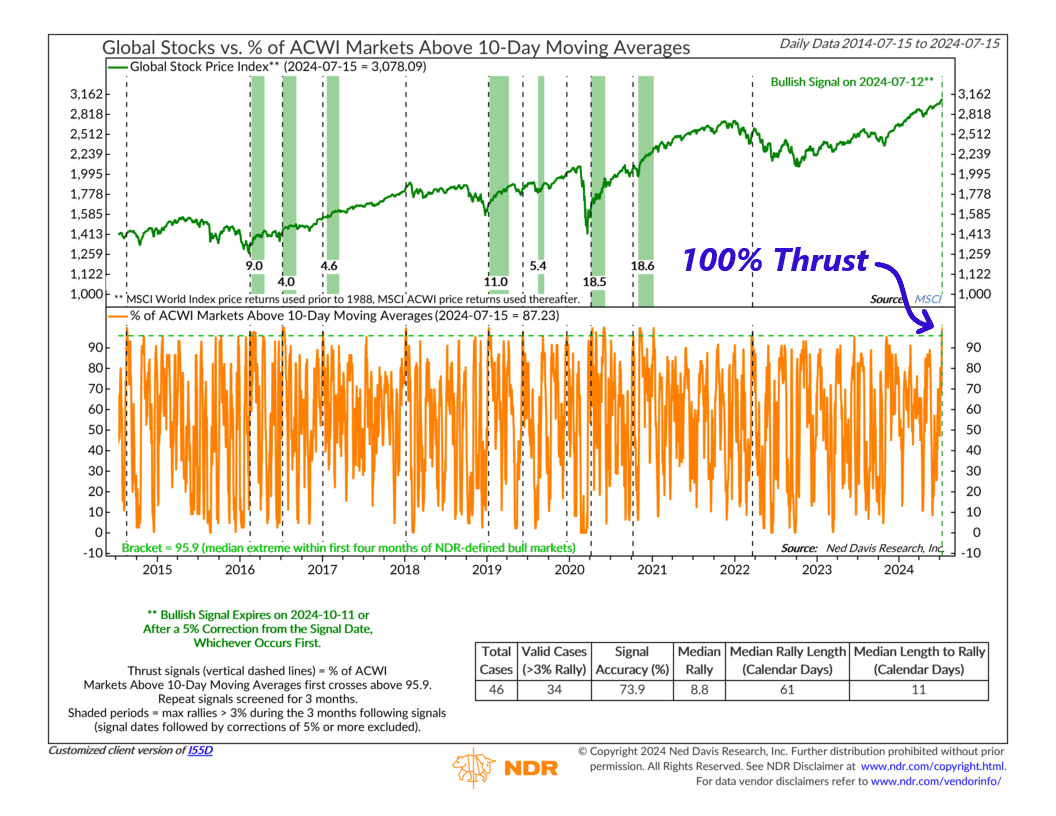
Specifically, as our featured indicator above shows, it happens when the percentage of global stock markets trading above their average 10-day level first climbs to 96% or more.
Going into the summer, this percentage was under 10%. Last Friday, it skyrocketed to 100%. In other words, every single stock market in the MSCI All-Country World Index was trading above its 10-day average. Incredible!
This indicator has generated a positive thrust signal 46 other times in history. In 34 of those cases, global stock prices have gone on to rally an average of 8.8% over the ensuing 60 days.
Of course, that means roughly 25% of the time, no rally occurs. If global stocks fall 5% or move from here, this positive thrust signal will be canceled. We have no way of knowing in advance, however, so we’ll just have to wait and see.
Looking ahead, if more thrust indicators like this one start to fire, it would bolster confidence in this indicator. That might also help tilt the weight of evidence in a more bullish direction, which could help stocks rally for the rest of the year.
This is intended for informational purposes only and should not be used as the primary basis for an investment decision. Consult an advisor for your personal situation.
Indices mentioned are unmanaged, do not incur fees, and cannot be invested into directly.
Past performance does not guarantee future results.
The MSCI ACWI captures large and mid cap representation across 23 Developed Markets and 24 Emerging Markets countries. With 2,935 constituents, the index covers approximately 85% of the global investable equity opportunity set.