This week’s indicator is what we call a “top watch” tool. It uses momentum metrics to spot when the stock market might be running out of steam after a strong rally.
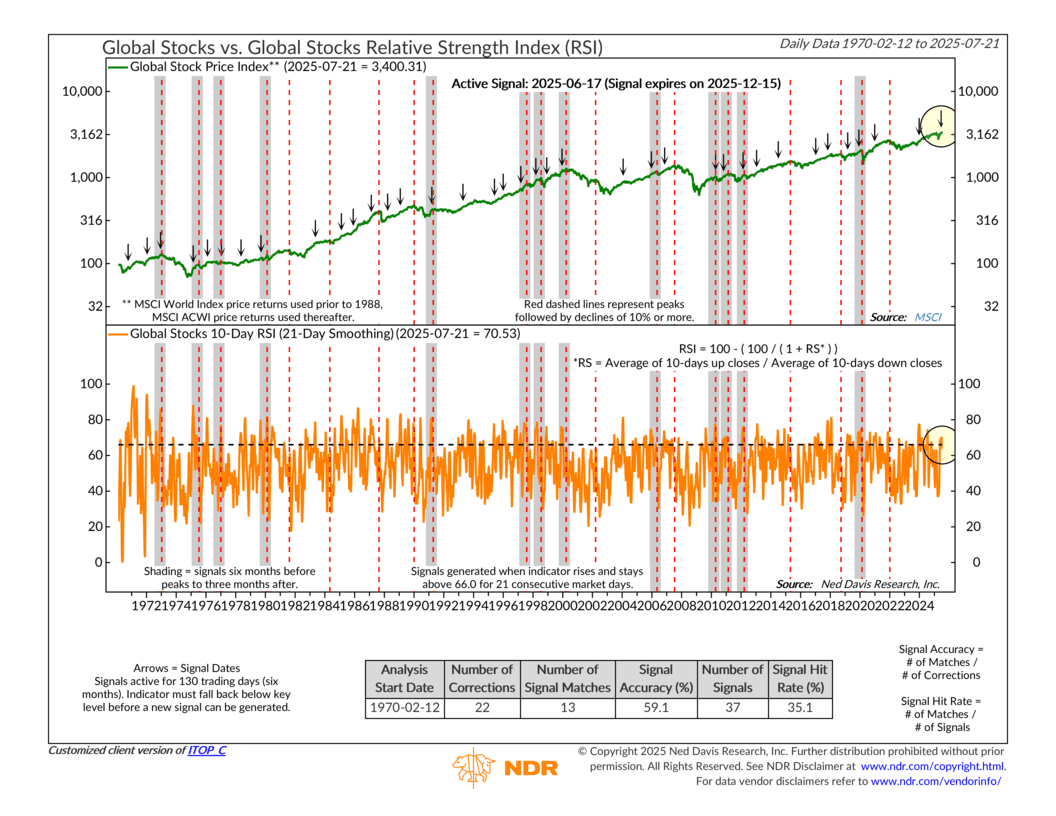
Here’s how it works. The top section of the chart shows the MSCI World Index, using data all the way back to 1970. The green line tracks global stock prices. The orange line below it is a smoothed version of the Global Stocks Relative Strength Index (RSI), a measure of momentum.
So what’s an RSI? Think of it as a temperature check for price strength. It tells us when markets are running hot (overbought) or cold (oversold). When the RSI gets too high, it’s often a sign that a top may be near.
In other words, strong momentum can carry prices higher, but if it stretches too long without a break, it can signal exhaustion. I like to think of it like a runner who’s gone a bit too hard for a bit too long.
On the chart, the red dashed lines mark prior peaks that were followed by declines of 10% or more. The shaded areas cover six months before and three months after those peaks. The black arrows point to when this particular signal was triggered—specifically, when the RSI rose above 66.0 and stayed there for 21 straight trading days.
As the stats box shows, this signal has a decent track record. Since 1970, there have been 37 signals. Of those, 22 were followed by corrections of 10% or more. That gives the signal a 59% accuracy rate and a 35% overall hit rate—not perfect, but helpful.
The most recent signal fired on June 17, 2025. It remains active through mid-December unless the RSI drops back below the threshold before then. As of July 21, RSI is still elevated at 70.5, so the warning remains in place.
So, what does that mean? Well, basically, global stocks had a strong run earlier this year, helped in part by a weak U.S. dollar following the tariff headlines. But that tailwind may be fading. And historically, when global momentum stalls, U.S. stocks have often done pretty well.
The bottom line? With an active RSI sell signal in place, the second half of the year could bring more volatility, and maybe even a shift in leadership. While it’s no guarantee that global stocks falter from here, this indicator does suggest that U.S. equities may be better positioned to carry the baton from here.
This is intended for informational purposes only and should not be used as the primary basis for an investment decision. Consult an advisor for your personal situation.
Indices mentioned are unmanaged, do not incur fees, and cannot be invested into directly.
Past performance does not guarantee future results.
The S&P 500 Index, or Standard & Poor’s 500 Index, is a market-capitalization-weighted index of 500 leading publicly traded companies in the U.S