When we measure what we call the “price movement” of the stock market, we look at more than just the price changes of a broad-market index like the S&P 500. Other price-related factors matter to stock price movements, as well.
Breadth is one of those factors. Breadth can be measured in various ways. But our indicator in the chart above focuses on the simple but powerful concept of volume supply and demand. It brings diversity to our indicators because it measures breadth in a way that incorporates not only price but volume as well into the analysis.
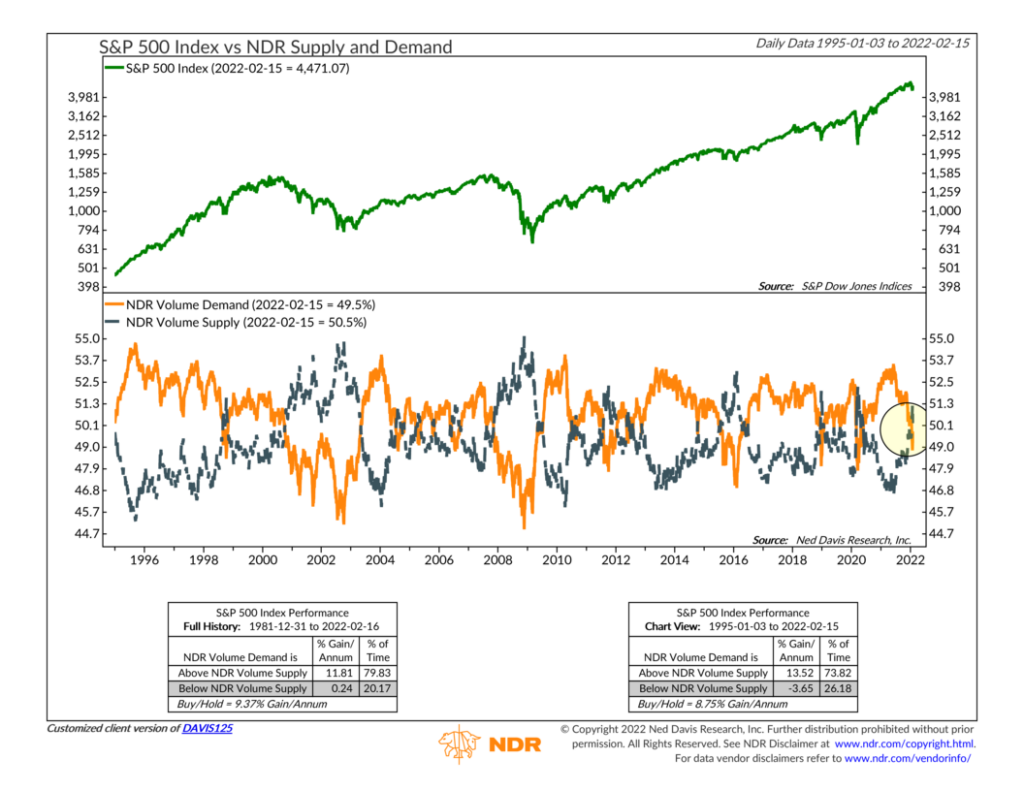
Here’s how it works. If a stock’s price increases for the day, we count all the shares traded on that day (its volume) to be advancing volume. We call this volume demand (orange line). But if a stock’s price falls that day, all its volume gets tallied on the declining or supply side of things. This is volume supply (dark blue line). If a stock’s price doesn’t change that day, it’s considered unchanged and is discarded from the analysis.
To smooth out volatility, the indicator sums both volume demand and volume supply over a certain period ranging from days to months. This creates a percentage for both volume demand and supply that will always add up to 100%.
For example, the most reading for volume demand is 49.5%, meaning 49.5% of the volume being traded in the U.S. stock market is going to stocks that are rising in price. In contrast, 50.5% of the volume is going to stocks that are falling in price. In other words, volume supply is outpacing volume demand.
This is concerning because, historically, when volume supply is above volume demand, the S&P 500 index (green line) has had low to even negative returns on a per annum basis, as shown on the mode boxes at the bottom of the chart.
But, when volume demand is higher than volume supply—as it is about 80% of the time—the S&P 500 has advanced around 11.8% a year, on average. This compares to a roughly 9.4% buy and hold gain over the entire period.
One of the core tenants of our investment philosophy is that we want to normally respect the trend or biased movement of the market. There’s no point in trying to stop a train after it’s gathered up enough momentum. This indicator helps us achieve our goal of staying on the right side of the trend by fusing price and volume into the simple but effective economic concept of supply and demand.
This is intended for informational purposes only and should not be used as the primary basis for an investment decision. Consult an advisor for your personal situation.
Indices mentioned are unmanaged, do not incur fees, and cannot be invested into directly.
Past performance does not guarantee future results.