This week’s indicator is based on a contrarian concept originated by the investment bank Merrill Lynch. It looks at the ratio of the number of stocks advancing plus one-half of those unchanged to the total number of issues traded. In other words, it’s a measure of market breadth.
We’ve talked before about how market breadth is a good indicator of stock market health. A powerful breadth thrust in either direction can be a sign of things to come. But here’s the thing. Sometimes it goes too far. When breadth momentum reaches an extreme and then stalls out, it can be a sign of overbought or oversold conditions.
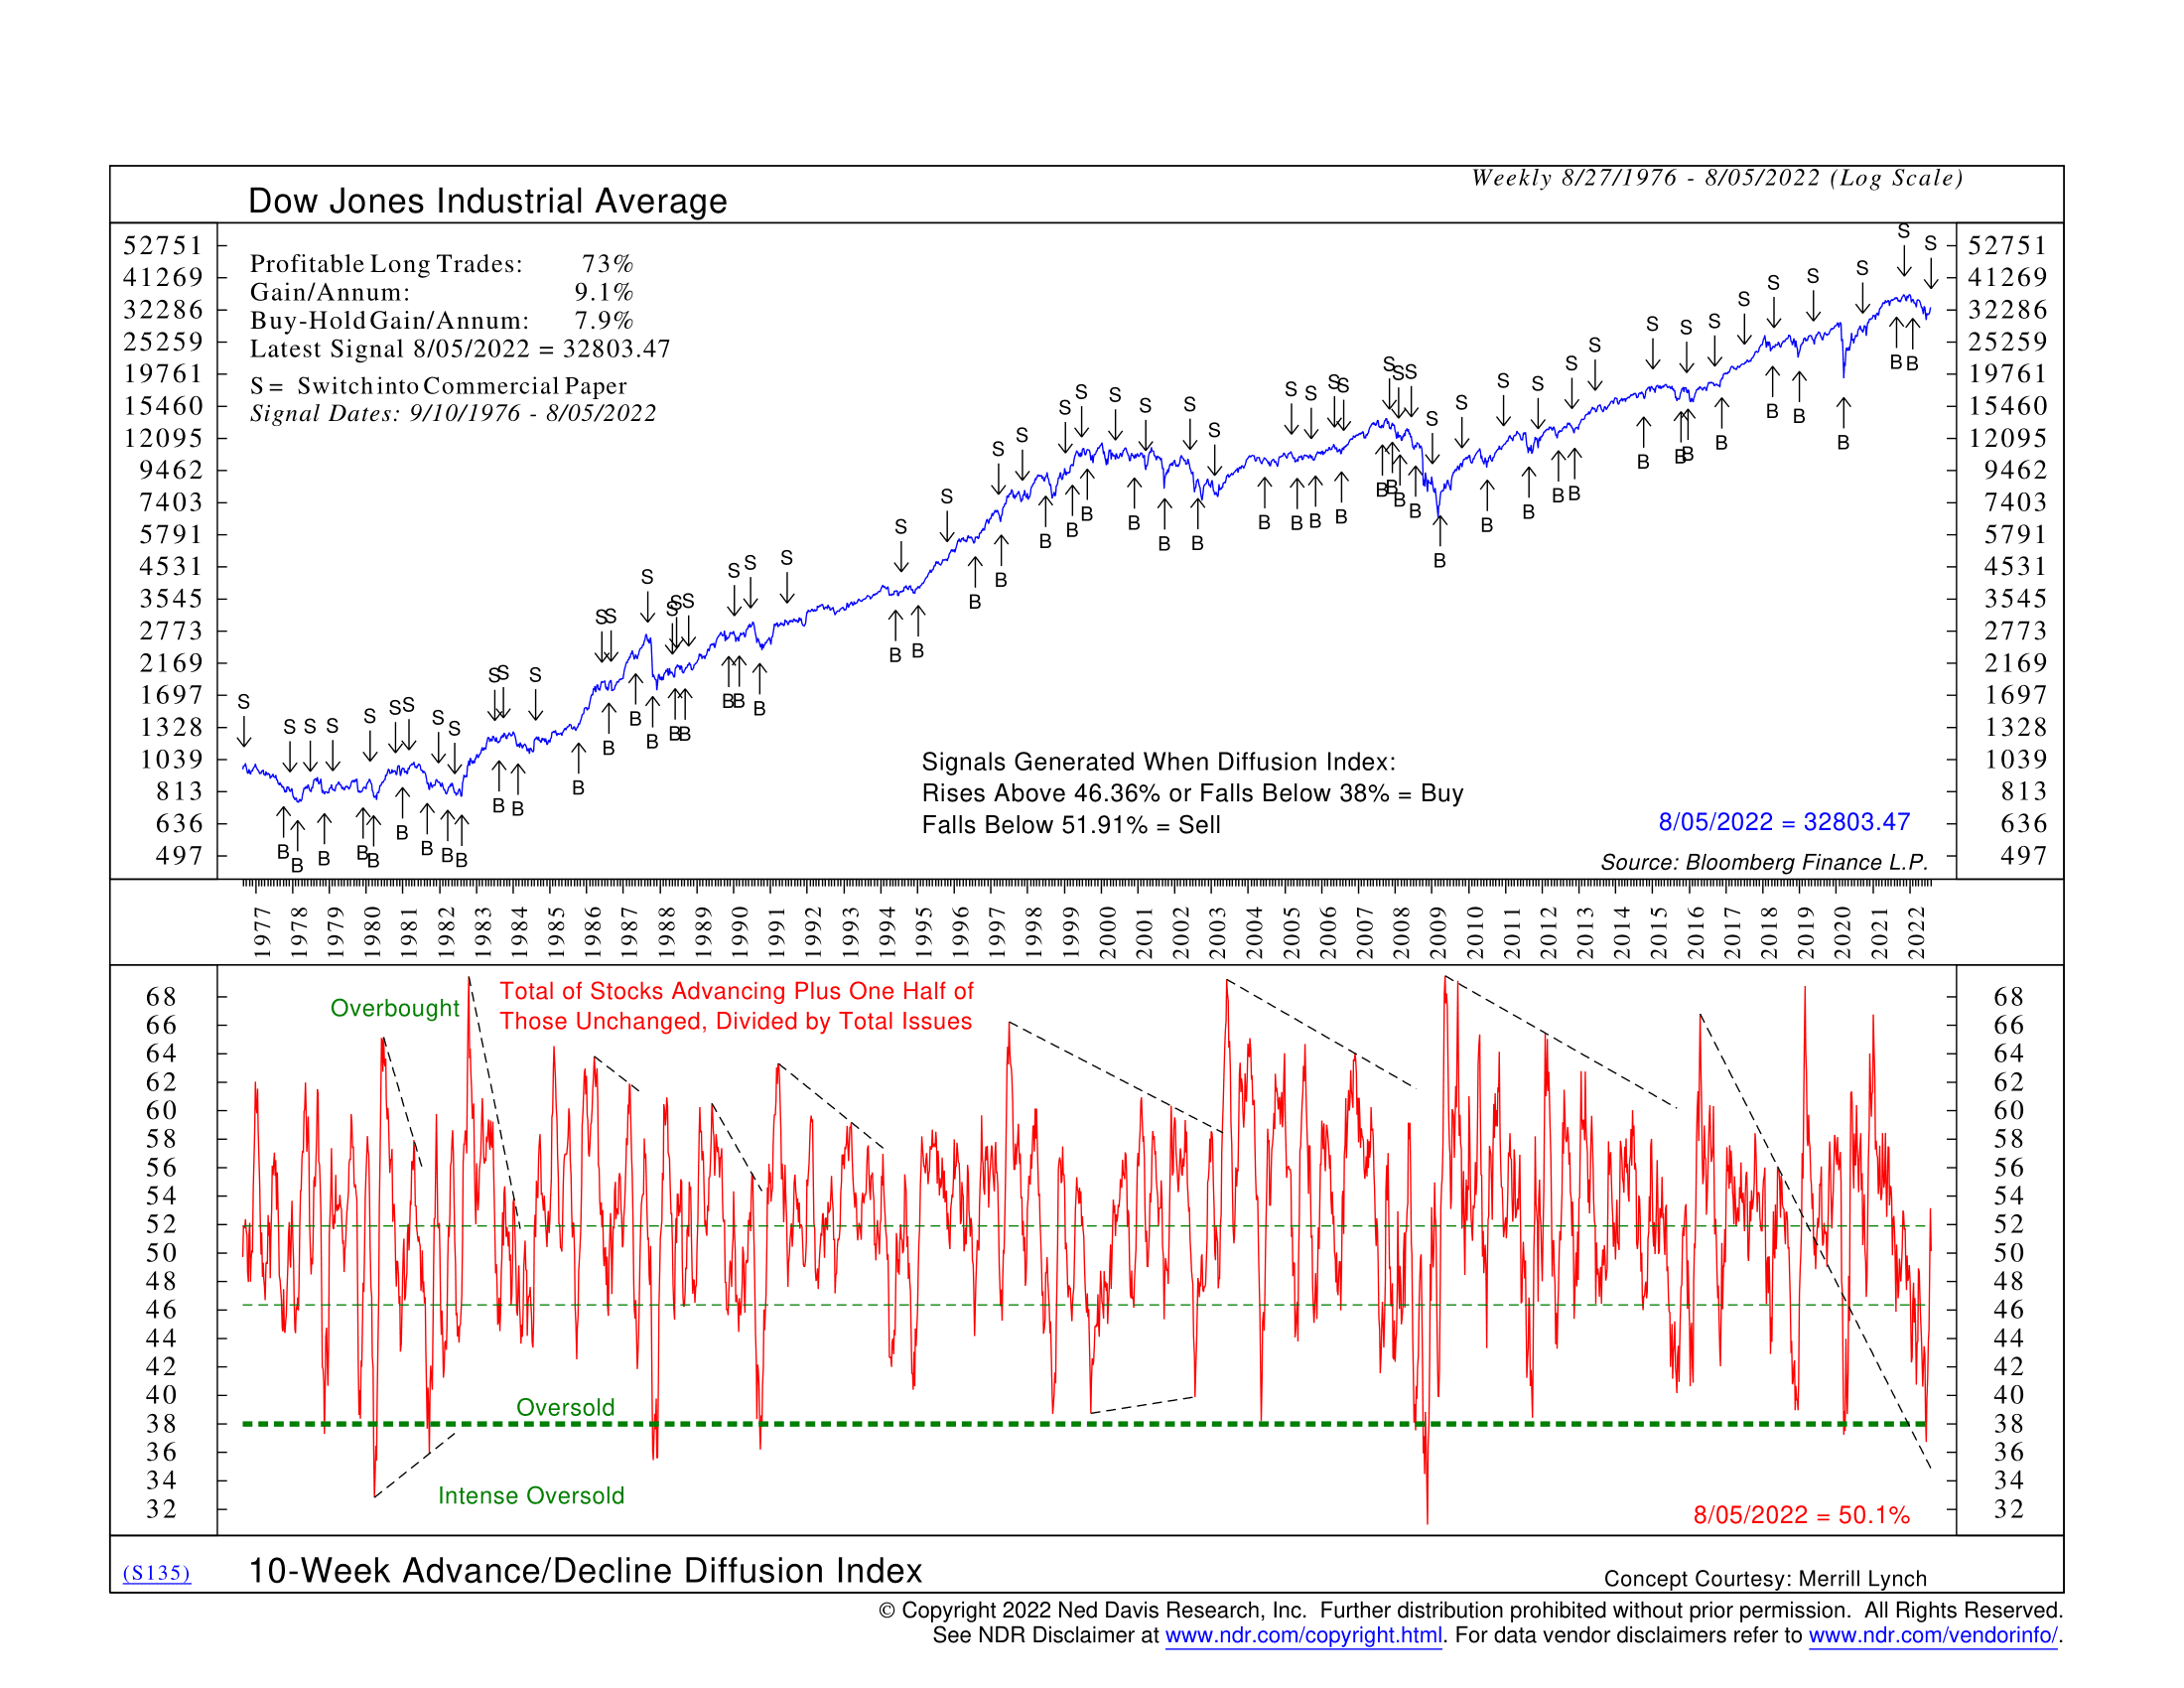
Here’s how we measure it. The red line on the bottom clip of the chart above shows the ratio of total stocks advancing (plus ½ of those unchanged) to the total number of stocks traded. This is the indicator. When optimized to historical data, we find that when it rises above a level of roughly 46% or falls below 38%, it’s been a positive sign for U.S. stocks—as measured by the Dow Jones Industrial Average (blue line, top clip). In other words, a moderate level of breadth momentum is good for stocks. But very poor breadth momentum is also good for stocks because it signifies oversold conditions.
On the flip side, when the indicator rises above a level of about 52% but then falls below it, it triggers a sell signal for the stock market. Stated another way, rising breadth momentum is bullish for the market until it reaches an extreme level and then stalls out. At that point, the overbought conditions set the market up for weaker returns.
The data in the top left corner shows the historical performance of this indicator. On average, a strategy that followed the buy and sell signals over the past 45 years would have generated returns of 9.1% per year, versus a buy and hold gain of 7.9% for the Dow. Of the long trades, 73% of them were profitable.
We bucket this type of indicator into the Overbought/Oversold category of indicators. It’s a key piece in the Overbought/Oversold Composite of our primary stock market risk model. When combined with the other indicators in the composite, it serves as a warning sign for when the market has reached extreme overbought or oversold conditions. Since this is a contrarian type of analysis, it helps us in our aim to go with the flow until the market reaches an extreme, and then we lean in the other direction.
This is intended for informational purposes only and should not be used as the primary basis for an investment decision. Consult an advisor for your personal situation.
Indices mentioned are unmanaged, do not incur fees, and cannot be invested into directly.
Past performance does not guarantee future results.