The U.S. dollar has been in the news a lot lately. Mainly because it’s been falling—a lot. Last year, the ICE U.S. Dollar Index, the benchmark index for the U.S. dollar, fell roughly 10%. This year, it’s already down another 2%.
But should we really be surprised by that move? Our featured indicator this week, shown above, suggests the answer is no.
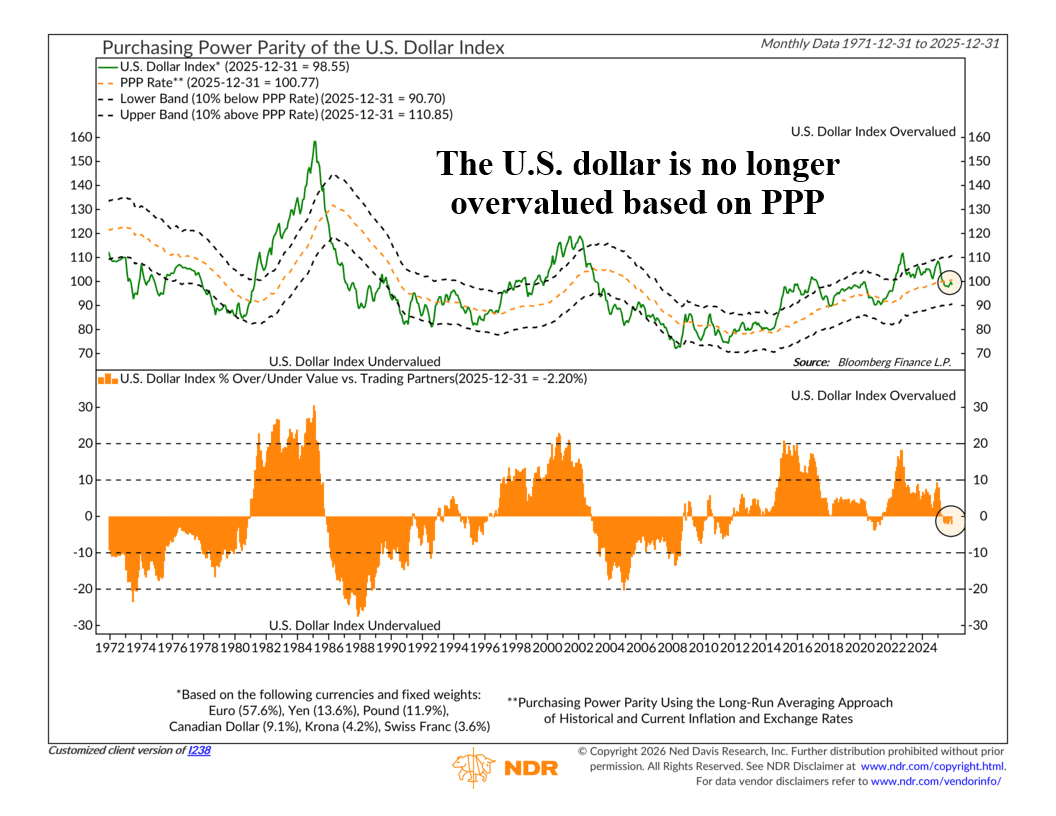
The goal of this chart is to show whether the U.S. dollar looks expensive or cheap relative to other major currencies.
Now, the U.S. Dollar Index (green line, top clip) is built from a fixed mix of currencies, mostly the euro, along with the yen, British pound, Canadian dollar, Swedish krona, and Swiss franc. Because the euro makes up more than half of the index, moves in Europe matter a lot for where the dollar goes.
To judge whether the dollar is stretched, this indicator uses something called purchasing power parity, or PPP (orange line, top clip). The basic idea is simple. Over long periods of time, exchange rates tend to move in a way that reflects differences in inflation. If prices rise faster in one country than another, the currency of the higher-inflation country should eventually weaken to keep purchasing power roughly in balance.
This chart estimates that long-term “fair value” by looking at historical inflation and exchange rates, then builds a range 10% above and below that PPP level. When the dollar trades well above that range, it suggests the dollar is expensive relative to its long-term purchasing power. When it trades well below the range, it suggests the dollar is cheap.
With that context, it becomes easier to see why a weaker dollar shouldn’t have come as a shock. As the bottom clip shows, by late 2022 the U.S. dollar was roughly 18% overvalued versus its trading partners. (I think we all remember how bad inflation got domestically). In other words, the dollar was already set up to fall based on purchasing power parity alone.
And the subsequent move lower has been pretty severe. In fact, according to this indicator, the dollar fell so much that it has now worked off that excess and sits right around fair value, even slightly undervalued, based on PPP.
That matters because the recent period of dollar weakness has been a tailwind for things like gold and foreign stocks. A falling dollar helped boost returns in those areas, even without dramatic moves in local markets. But now that the dollar is much closer to where it “should” be, that tailwind may be harder to rely on going forward. Unless, of course, the dollar continues to fall deeper into undervalued territory—which, based on the history of the chart, is very much within the realm of possibilities, so we aren’t counting that out.
But the bigger takeaway is that the U.S. dollar has done a lot of adjusting already. What happens next likely depends less on the valuation catch-up we’ve outlined in this week’s indicator and probably more on things like fundamentals, growth, inflation, and relative interest rates across the global economy going forward.
This is intended for informational purposes only and should not be used as the primary basis for an investment decision. Consult an advisor for your personal situation.
Indices mentioned are unmanaged, do not incur fees, and cannot be invested into directly.
Past performance does not guarantee future results.
The U.S. Dollar Index (DXY) measures the value of the U.S. dollar against a basket of major foreign currencies using fixed weights.