by NelsonCorp Wealth Management | Aug 5, 2022 | Chart of the Week
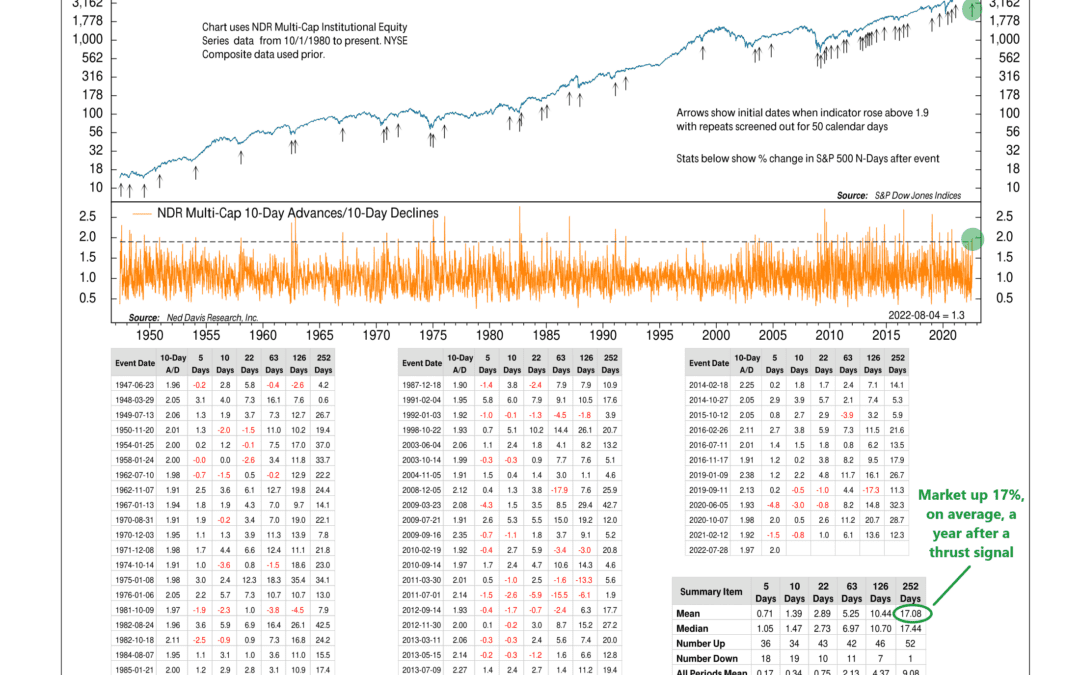
This week’s featured chart shows why the recent rally in the stock market might have some legs. The chart, shown above, is a “breadth thrust” indicator that measures the ratio of advancing stocks to declining stocks. Specifically, it takes the ratio of the...

by NelsonCorp Wealth Management | Aug 4, 2022 | Indicator Insights
This week, I want to feature an indicator we’ve recently discussed on the blog. It’s a price-based indicator that measures reversals in the stock market. Specifically, it generates buy and sell signals for the S&P 500 index based on percentage reversals...

by NelsonCorp Wealth Management | Aug 1, 2022 | Weekly Market Thoughts
OVERVIEW The U.S. stock market finished a strong month of July, with the S&P 500 soaring 4.26% for the week. The Dow Jones Industrial Average posted a gain of 2.97%, and the Nasdaq Composite rose 4.7%. Foreign stocks did well, too. Developed country stocks...

by NelsonCorp Wealth Management | Jul 29, 2022 | Chart of the Week
This week, the Commerce Department announced that real GDP fell at a seasonally adjusted annual rate of 0.9% in the second quarter. This followed a 1.6% decline in the first quarter. Taken together, that’s two consecutive quarters of declining real GDP, which...
by NelsonCorp Wealth Management | Jul 28, 2022 | Indicator Insights
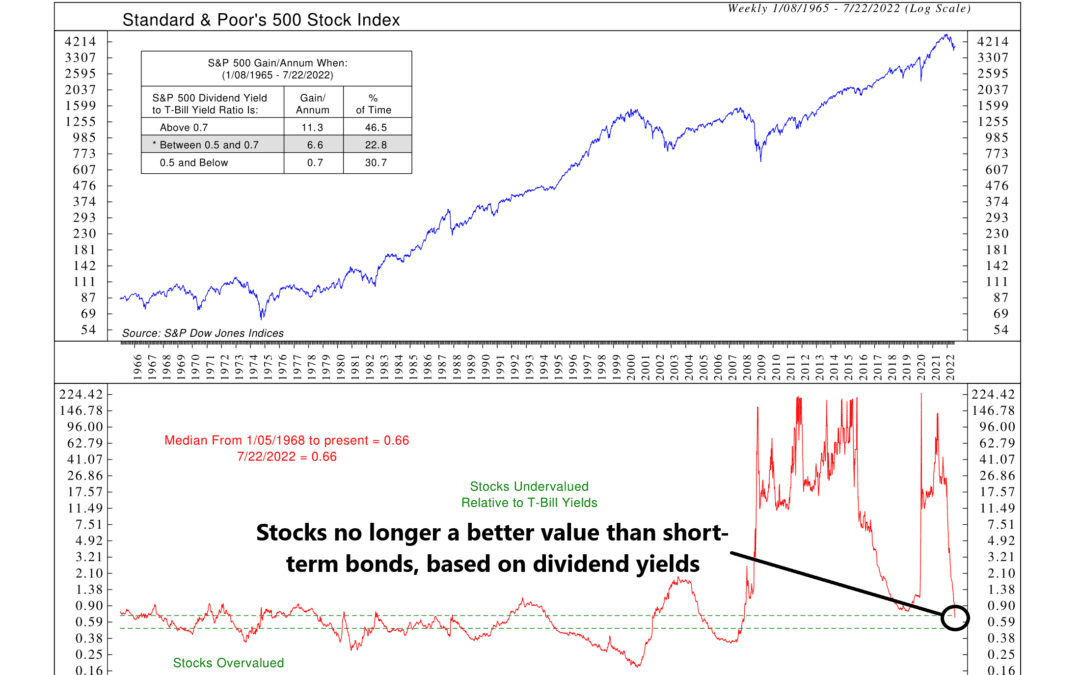
Near the end of the 1990s, two well-known economists, Robert Shiller and John Campbell argued that the high ratio of stock prices to dividends indicated that the stock market was seriously overvalued. In other words, they thought the dividend yield (dividends...
