
On the MOVE
This week’s featured chart is the ICE BofA MOVE Index, a well-known measure of U.S. interest rate volatility. Specifically, the MOVE Index calculates future volatility in U.S. Treasury yields implied by prices of one-month options on Treasuries of various...

It’s All Relative
For this week’s indicator, we feature a chart showing the relative valuation of stock dividends and Treasury bond yields. The idea behind the indicator is that stocks and bonds compete for investor dollars. So by comparing their yields, we can get a sense of...

Cumulative Tightening—But Not Yet!
OVERVIEW U.S. stocks fell last week, with the S&P 500 declining by 3.4%. The index is now up 5.4% from its October 12 closing low of 3,577.03 and down 21.3% from its January 3 closing high of 4,796.56. The Dow Jones Industrial Average did relatively better,...

Dow on Top
This week’s featured chart compares the annualized returns of two of the most popular stock mark indexes in the United States: The NASDAQ Composite and the Dow Jones Industrial Average. The blue line represents the annualized returns of the NASDAQ composite...

It’s All About the Benjamins
For this week’s indicator, I want to delve a little deeper into this idea of the money supply and how it affects the stock market. In general, we know that more liquidity is good for the stock market. However, the money supply—a component of liquidity—also...

Trust but Verify
OVERVIEW The Dow Jones Industrial Average rose 5.7% last week, capping its fourth consecutive week of gains and its best four-week stretch since April 2020. The S&P 500 Index rose 4%, notching its best two-week period since November 2020. And pulling up the...

The Last Curve Standing—No More
Well, it finally happened. Of all the leading indicators flashing red for the economy, the 3-month/10-year Treasury yield curve was one of the few to remain positive—until now. As our featured chart shows, the 3-month/10-year Treasury yield curve...

Gaining/Losing Leverage
For this week’s indicator, we look at margin debt and how we use it to measure market sentiment. Margin debt is a measure of the amount of stock market borrowing that investors are doing with their brokerage accounts. When there is an increase in margin debt,...

Market Mourning
OVERVIEW A relief rally hit Wall Street last week as all three major U.S. stock indices ended in the green. The S&P 500 rose 4.7%, up two of the past three weeks. Same with the Nasdaq Composite, which rose 5.2% for the week. And the Dow Jones Industrial...
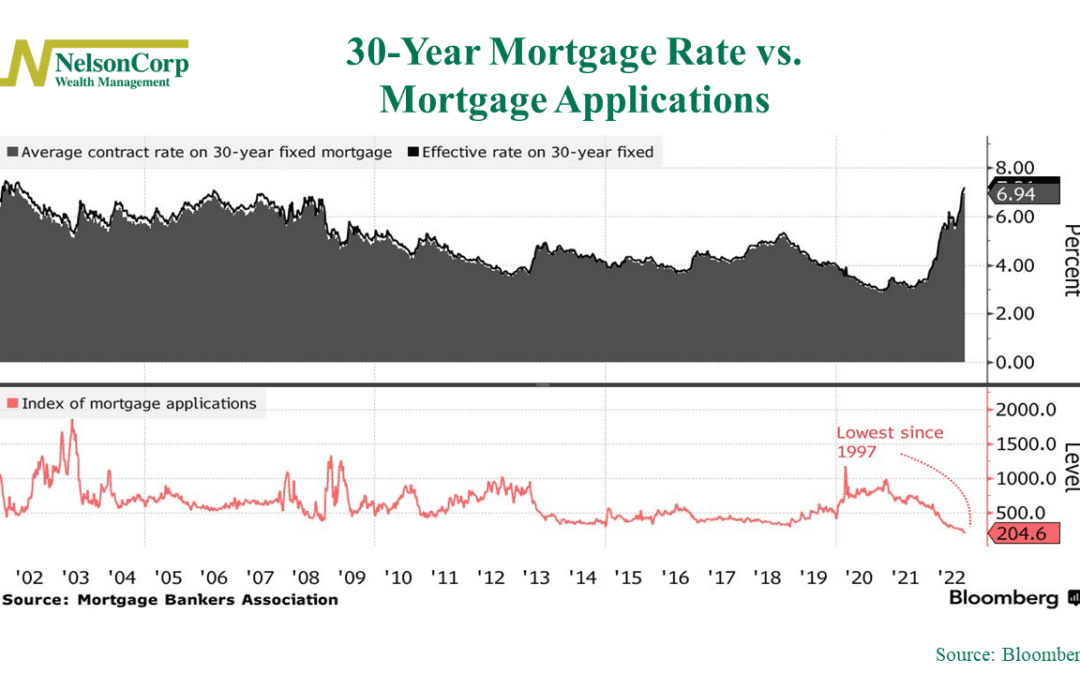
Housing Halt
This week’s chart looks at mortgage rates and how their sharp rise this year has led mortgage applications to drop to their lowest level since 1997. Specifically, the top half of the chart shows the average rate for a 30-year fixed mortgage, going back to the...

880 13th Avenue North
Clinton, Iowa 52732
563-242-9042
5465 Utica Ridge Road
Davenport, Iowa 52807
563-823-0532
9079 East Tamarack Drive
Dubuque, Iowa 52003
800-248-9042
info@nelsoncorp.com
Fax: 563-242-9062
Securities offered through Registered Representatives of Cambridge Investment Research, Inc., a broker-dealer, member FINRA/SIPC. Advisory services through Cambridge Investment Research Advisors, Inc., a Registered Investment Advisor. Cambridge and NelsonCorp Wealth Management are not affiliated. This communication is strictly intended for individuals residing in the states of AZ, AR, CA, CO, CT, FL, GA, IA, IL, IN, ME, MI, MN, MO, NC, NJ, NY, SD, TN, TX, UT, WI, and WY. No offers may be made or accepted from any resident outside the specific states referenced. Investing involves risk. Depending on the different types of investments there may be varying degrees of risk. Clients and prospective clients should be prepared to bear investment loss including loss of original principal.
Cambridge’s Form CRS (Customer Relationship Summary)
The information being provided is strictly as a courtesy. When you link to any of these websites provided herein, NelsonCorp Wealth Management makes no representation as to the completeness or accuracy of information provided at these sites. Nor is the company liable for any direct or indirect technical or system issues or any consequences arising out of your access to or your use of third-party technologies, sites, information, and programs made available through this site.