
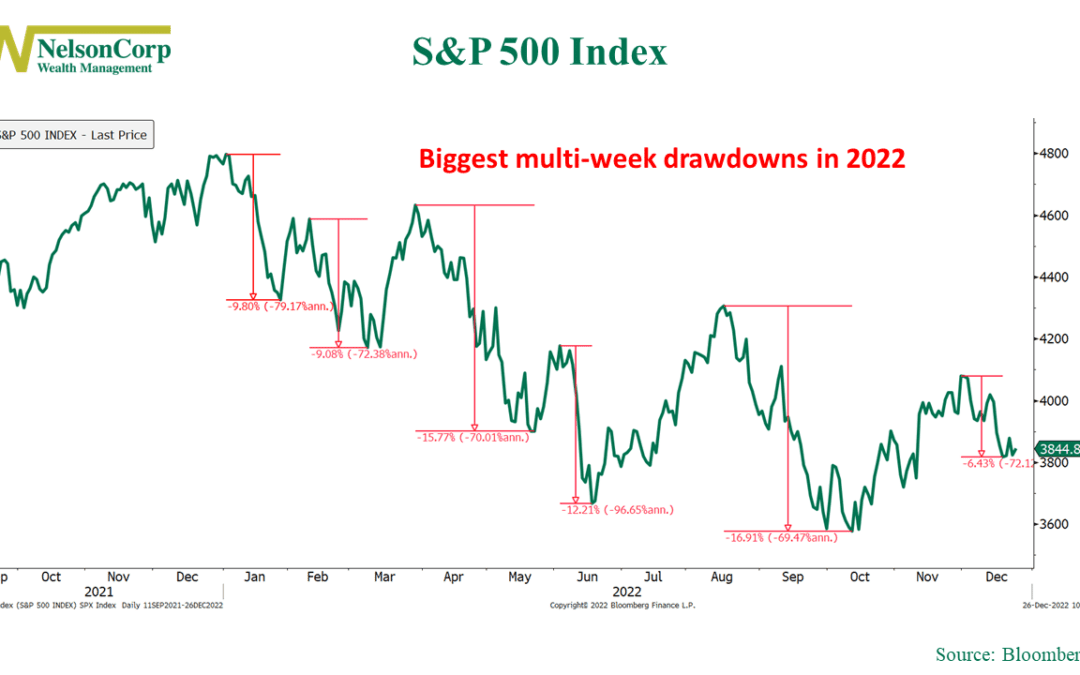
The Drawdown Dance
OVERVIEW Last week, the U.S. stock market experienced a mix of movements. The VIX Index, which measures volatility, decreased by approximately 7.7% to a level of 22. The S&P 500 Index decreased by 0.2%, the Nasdaq Composite fell by 1.94%, but the Dow Jones...
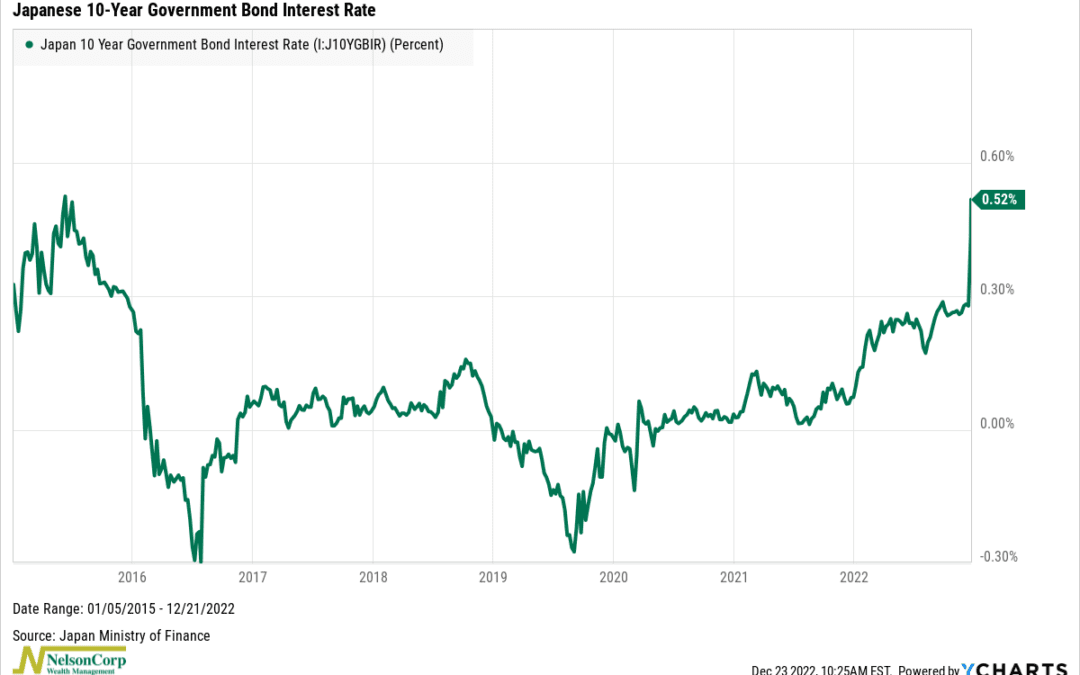
Loosening the Reins
Japan’s central bank, the Bank of Japan, made quite a stir in the financial world this week when it announced that it is relaxing the allowed trading band for 10-year Japanese government bonds (known as JGBs) by 25 basis points. This means that, after keeping...
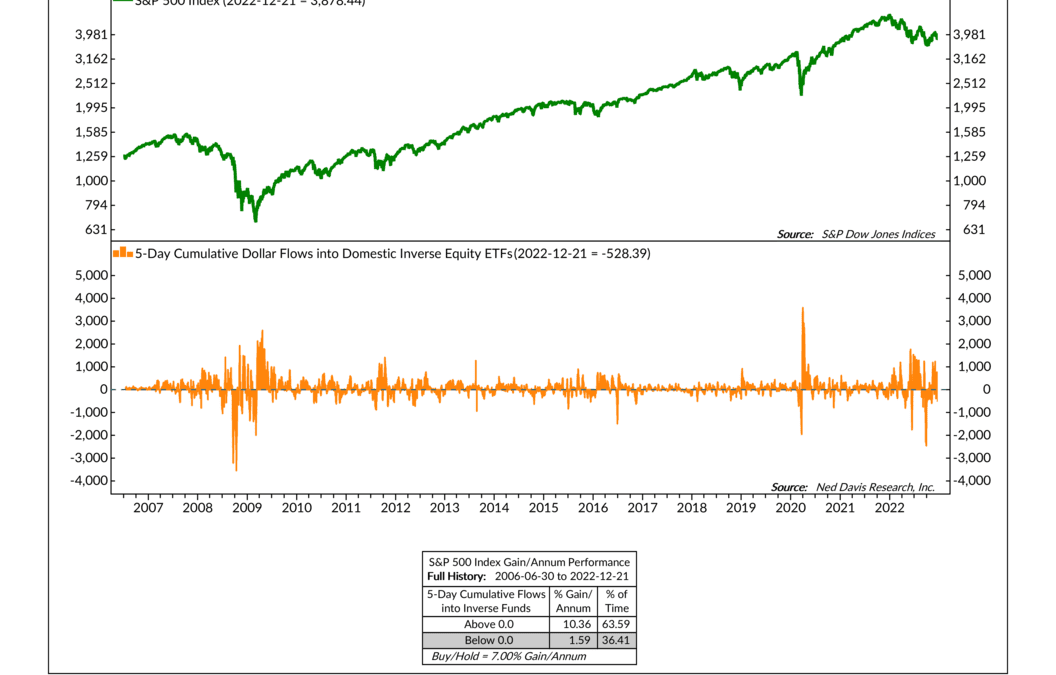
Countercurrents
Usually, when people think about money flowing into the stock market, they associate it with positive returns. However, as this week’s featured indicator shows, that isn’t always the case for exchange-traded products (ETFs). Specifically, asset flows into...
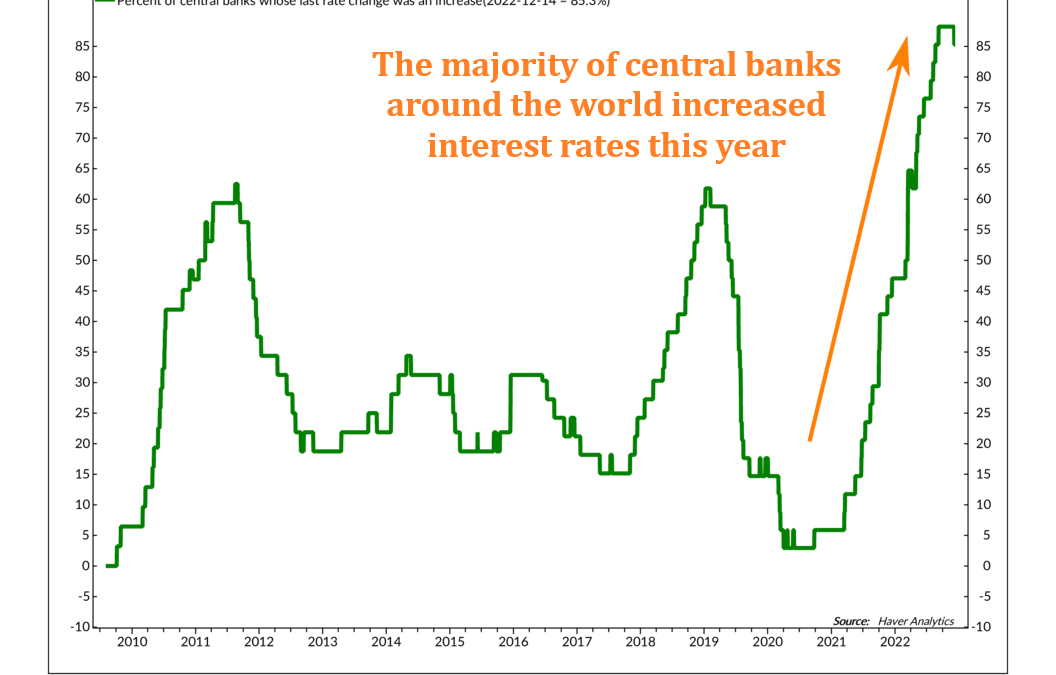
A Hawk on Every Branch
OVERVIEW Last week, the S&P 500, Dow Jones Industrial Average, and Nasdaq Composite all saw negative returns, with the Nasdaq experiencing the largest drop at -2.72%. The Dow fell -1.66%, and the S&P 500 decreased -2.08%. The VIX Index, which measures...
Fighting the Fed
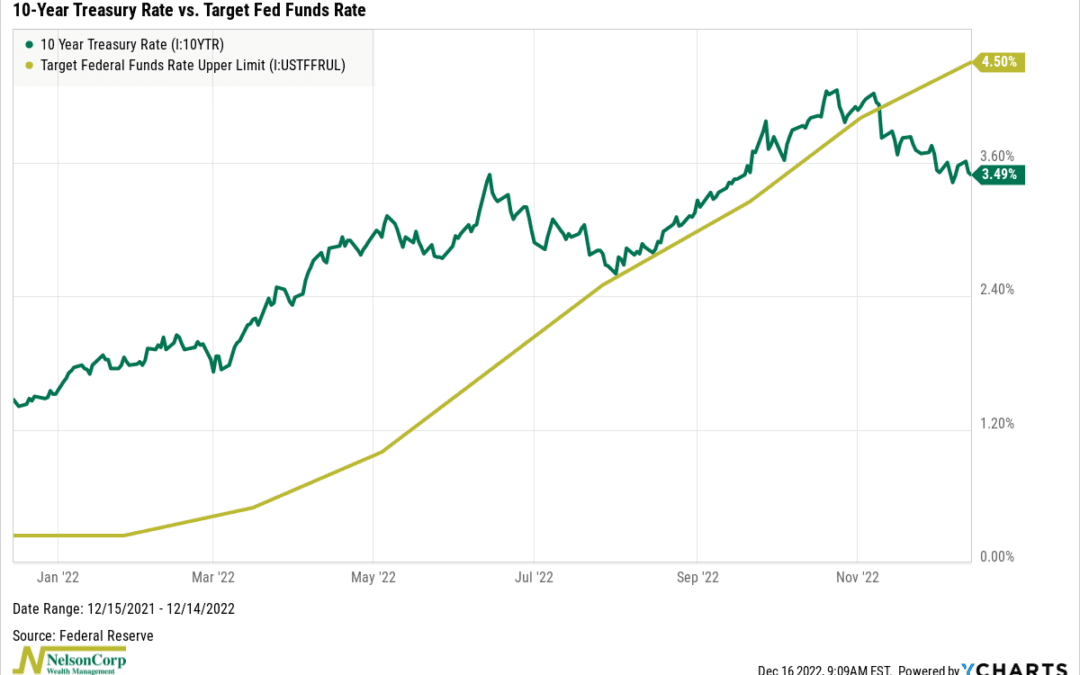
This week’s chart features two extremely important interest rates for the U.S. economy: the 10-year Treasury rate and the fed funds rate. The 10-year Treasury rate is a longer-term rate that the U.S. government charges on the money it borrows for ten years. By...
Beta is the New Alpha
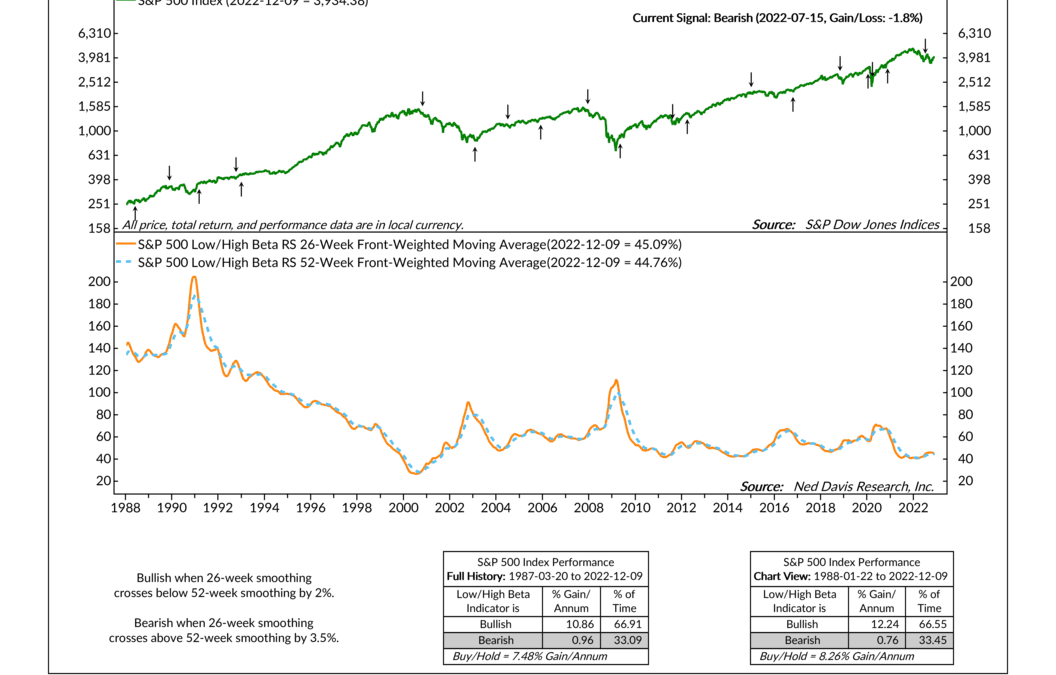
Relative strength is a powerful tool used to model stock market risk. It measures the performance of a security or group of securities to another group of securities to determine outperformance. For example, we like to look at the relative strength of low and...
Rejected
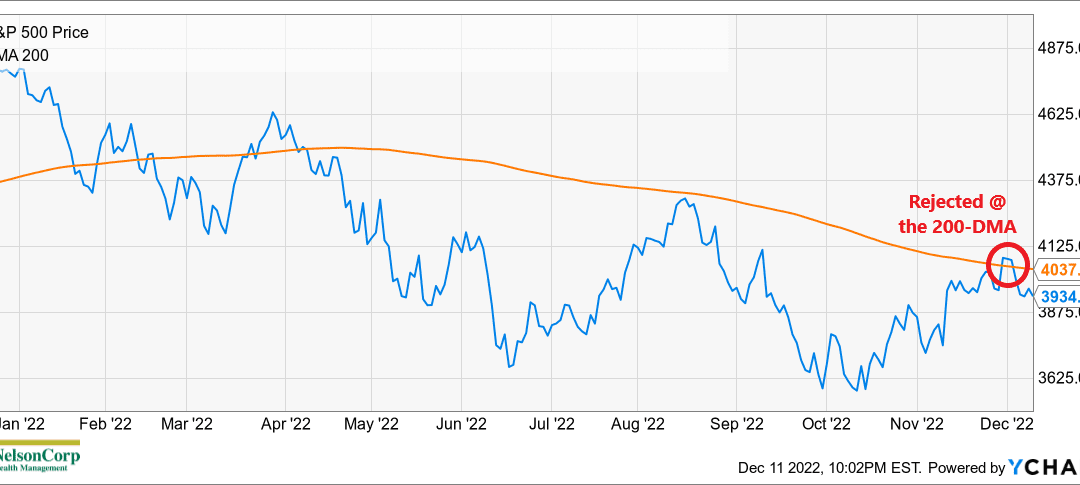
OVERVIEW The U.S. stock market stumbled last week as volatility came rushing back to Wall Street. The S&P 500 Index slipped 3.4%, the Dow Jones Industrial Average fell 2.8%, and the Nasdaq Composite dropped 4%. Foreign stocks, however, were mixed. The MSCI...
Feels Longer Than It Is
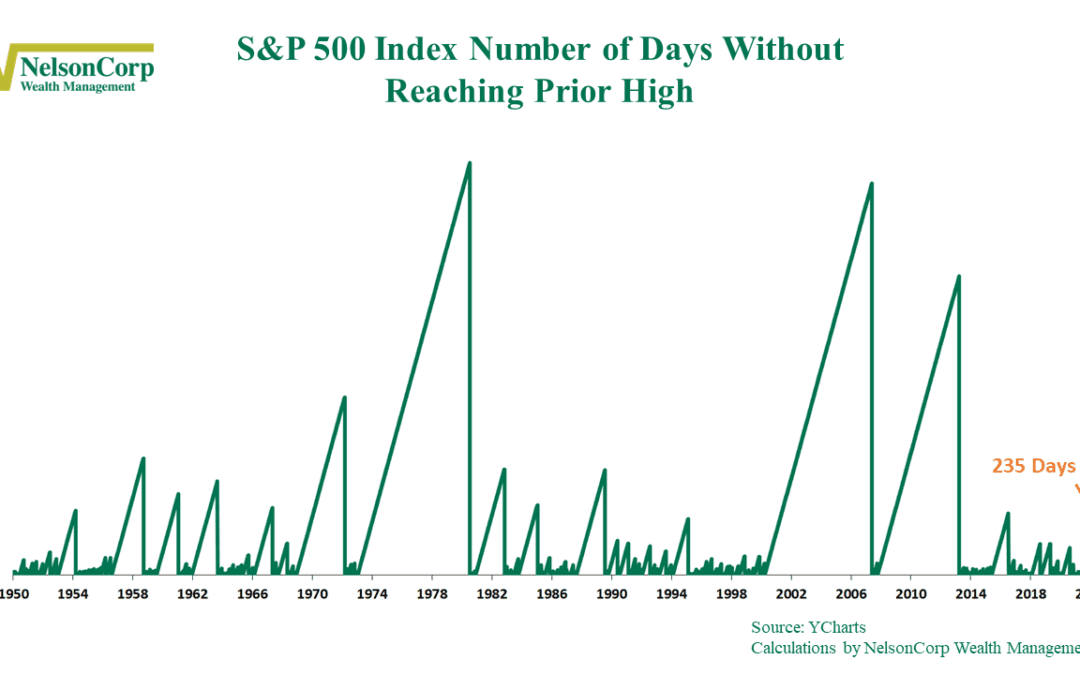
The S&P 500 Index is a popular stock market index often used to measure the overall health of the U.S. stock market. One way to gauge the strength of the market is to look at the number of days the index spends below its prior high. As I’ve pointed out on...

Meeting the Trendline
OVERVIEW The U.S. stock market continued to rally last week, with the S&P 500 Index gaining 1.13%, the Dow Jones Industrial Average climbing 0.24%, and the Nasdaq Composite rising 2.09%. Foreign stocks were also up on the week, with the MSCI EAFE Index of...

Gone Global
We’ve talked some this year about the U.S. yield curve and how its inversion is signaling that a recession could be right around the corner. But it’s not just a U.S. problem. Global bonds joined the party this week. The chart above shows that the average yield...

880 13th Avenue North
Clinton, Iowa 52732
563-242-9042
5465 Utica Ridge Road
Davenport, Iowa 52807
563-823-0532
9079 East Tamarack Drive
Dubuque, Iowa 52003
800-248-9042
info@nelsoncorp.com
Fax: 563-242-9062
Securities offered through Registered Representatives of Cambridge Investment Research, Inc., a broker-dealer, member FINRA/SIPC. Advisory services through Cambridge Investment Research Advisors, Inc., a Registered Investment Advisor. Cambridge and NelsonCorp Wealth Management are not affiliated. Financial Professionals may only conduct business with residents of the states or jurisdictions in which they are properly registered, licensed or exempt from registration and not all of the securities, products and services mentioned are available in every state or jurisdiction. Investing involves risk. Depending on the different types of investments there may be varying degrees of risk. Clients and prospective clients should be prepared to bear investment loss including loss of original principal.
Cambridge’s Form CRS (Customer Relationship Summary)
The information being provided is strictly as a courtesy. When you link to any of these websites provided herein, NelsonCorp Wealth Management makes no representation as to the completeness or accuracy of information provided at these sites. Nor is the company liable for any direct or indirect technical or system issues or any consequences arising out of your access to or your use of third-party technologies, sites, information, and programs made available through this site.