by NelsonCorp | Jun 13, 2025 | Chart of the Week
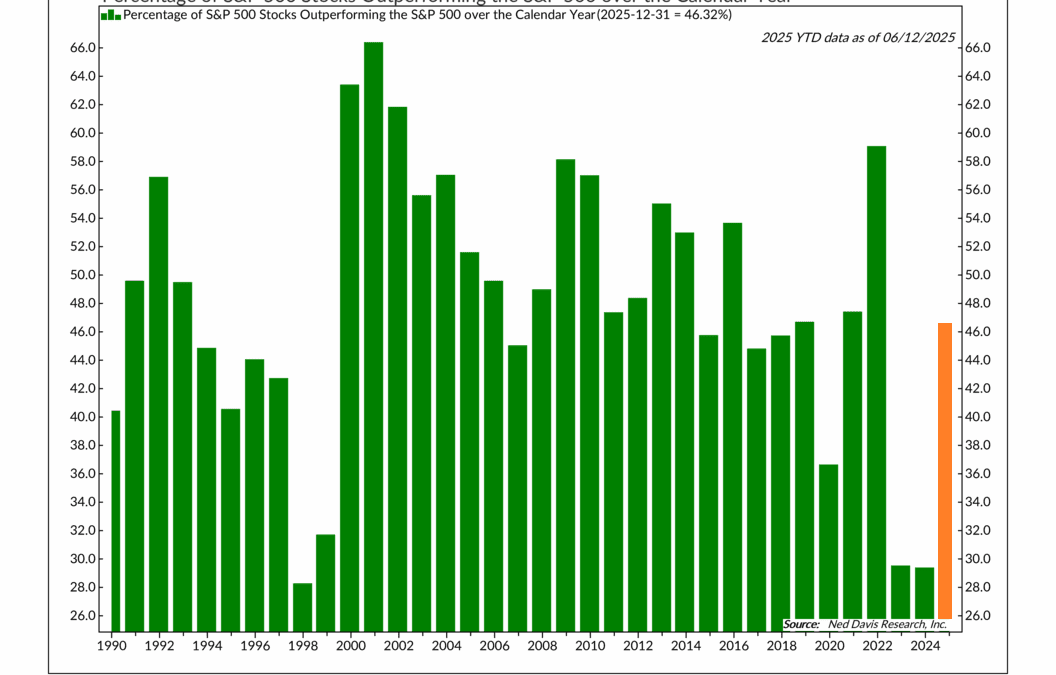
This week’s chart shows that more stocks are pulling their weight in 2025. After two years of gains driven by just a handful of tech giants, nearly half of the S&P 500 is now beating the index—bringing the market back to a more balanced and healthier place.
by NelsonCorp | Jun 6, 2025 | Chart of the Week
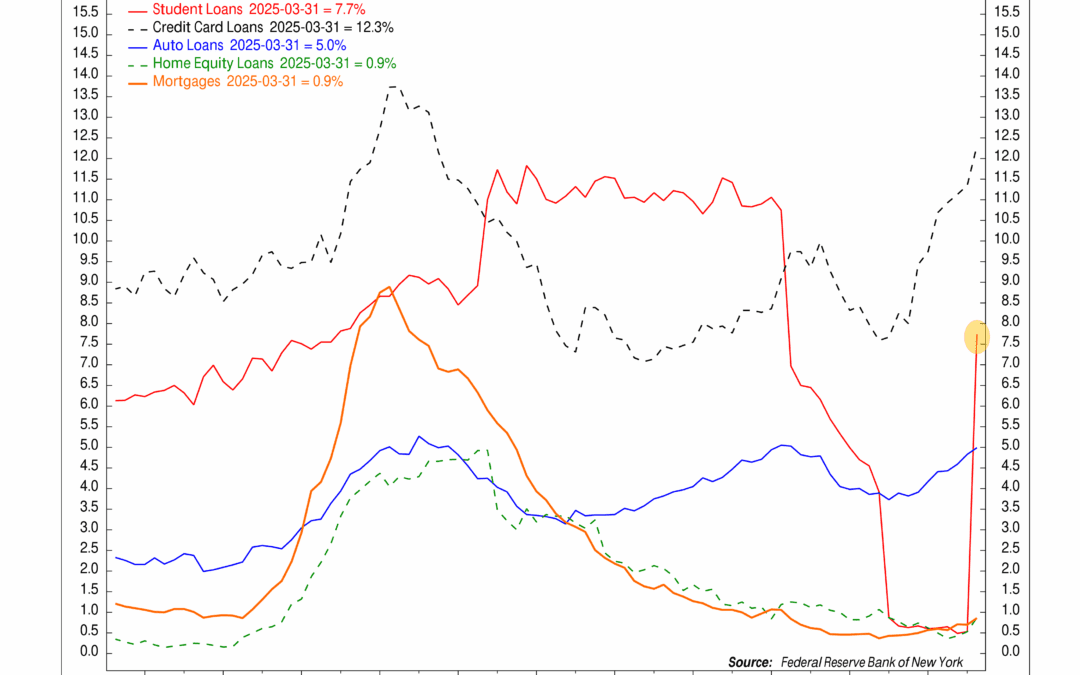
Americans are falling behind on student loans at the fastest pace in years. With savings shrinking and debt piling up, the financial strain is starting to show.

by NelsonCorp | May 30, 2025 | Chart of the Week
Interest rates are rising—and so are the headlines. But while the U.S. 10-year Treasury yield has been labeled everything from a warning sign to a market menace, the reality might be far less dramatic. This week’s chart puts the move in context, showing that today’s yields aren’t unusually high—they’re just not unusually low anymore.

by NelsonCorp | May 23, 2025 | Chart of the Week
Moody’s just hit the U.S. with a downgrade—should you be worried? History says the real story might be what happens after the headlines fade.
by NelsonCorp | May 16, 2025 | Chart of the Week
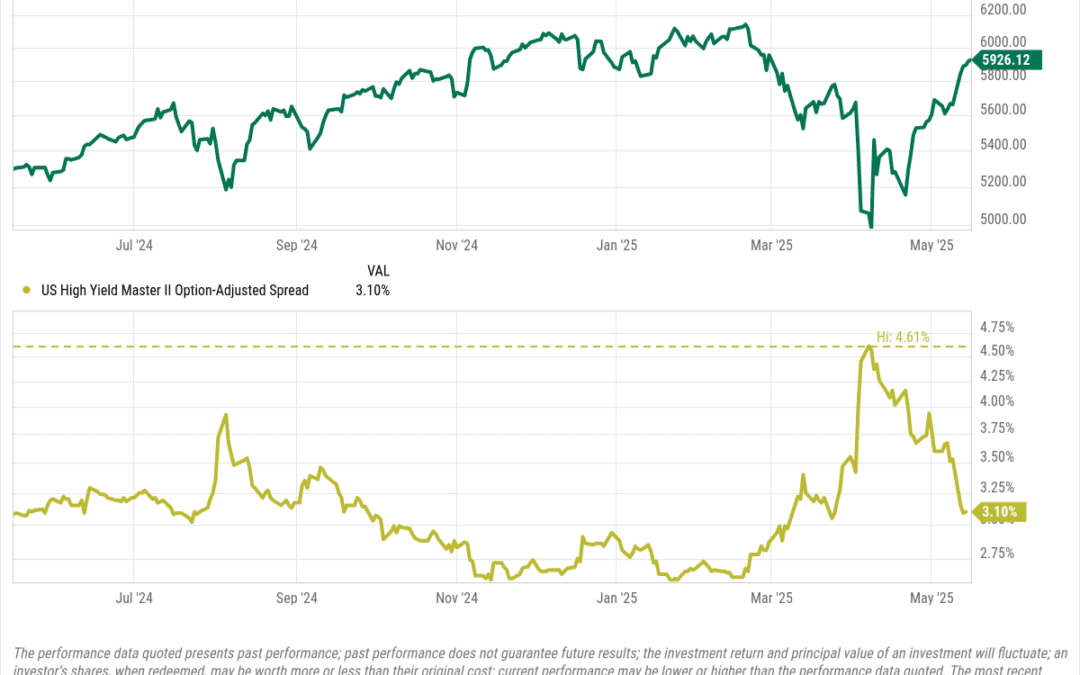
After a sharp spike in early April, credit spreads are once again signaling smooth sailing in the bond market—and by extension, the stock market. The chart above shows U.S. high yield spreads tightening sharply—down 151 basis points since peaking at 4.61% on...
by NelsonCorp | May 9, 2025 | Chart of the Week
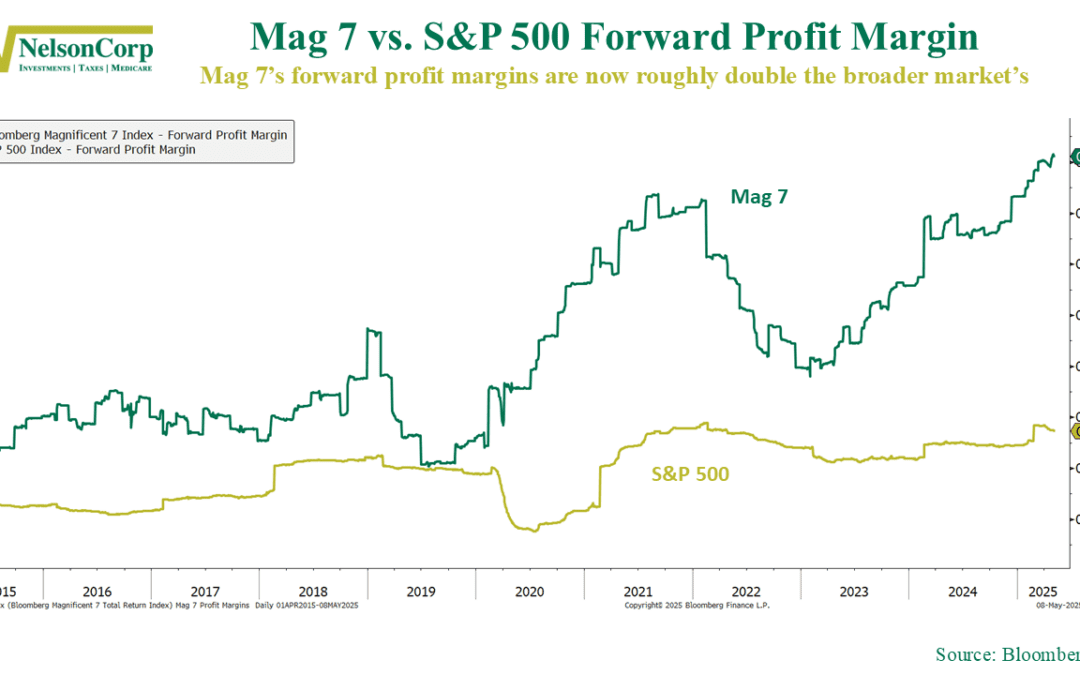
This week’s chart shows that when it comes to profitability in the stock market, the big just keep on getting better. What do I mean? Well, this week’s chart shows the forward (expected) profit margins of the seven largest tech companies in the S&P 500...
