by NelsonCorp Wealth Management | Dec 27, 2024 | Chart of the Week
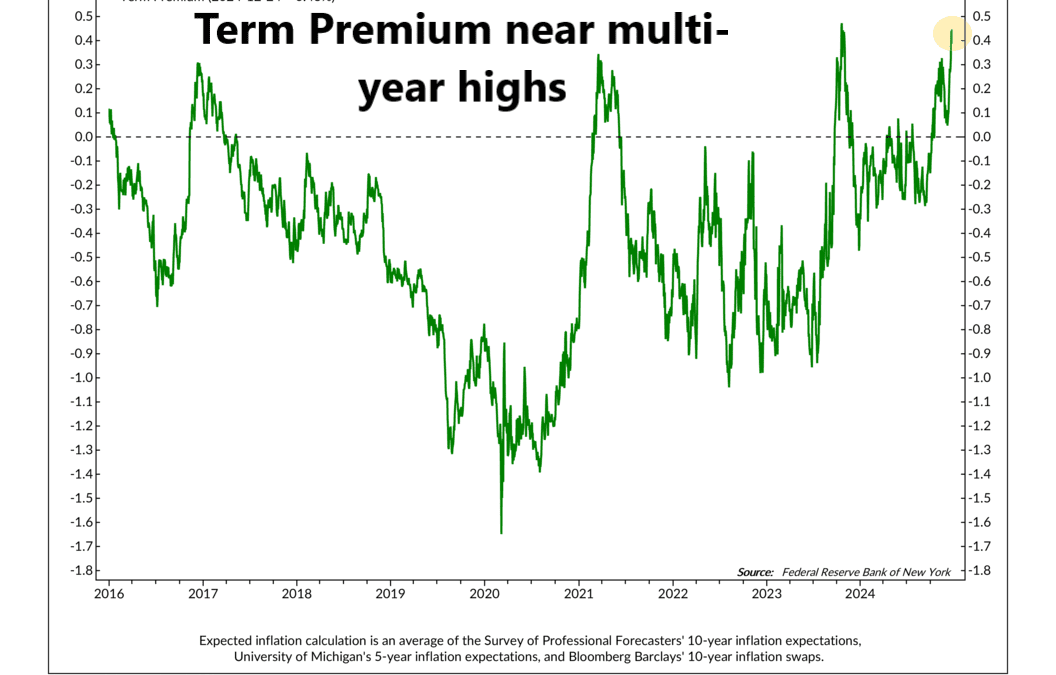
This week’s chart highlights the surge in the term premium on U.S. Treasuries—the extra return investors demand for holding long-term bonds instead of short-term ones. Think of it like asking for a bigger reward to lock your money away for longer because the...
by NelsonCorp Wealth Management | Dec 20, 2024 | Chart of the Week
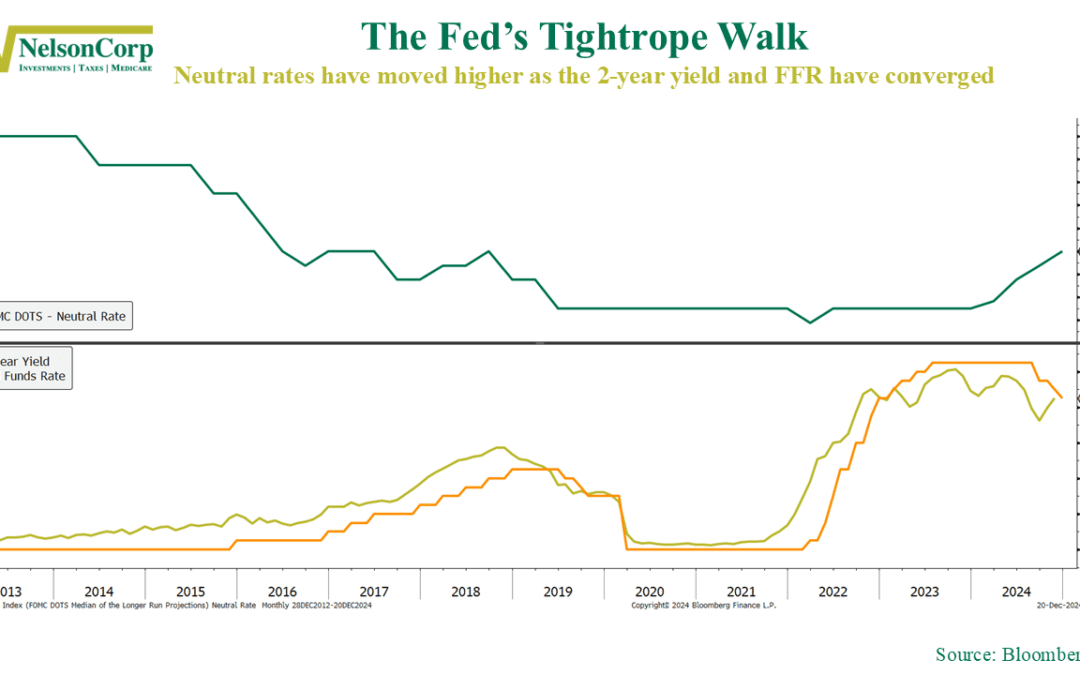
The Federal Reserve shook up financial markets this week, with stocks sliding after yet another rate cut. But it wasn’t the cut itself that rattled investors—it was the Fed’s revised projection for the “neutral rate,” shown in green on the chart. This neutral...
by NelsonCorp Wealth Management | Dec 13, 2024 | Chart of the Week
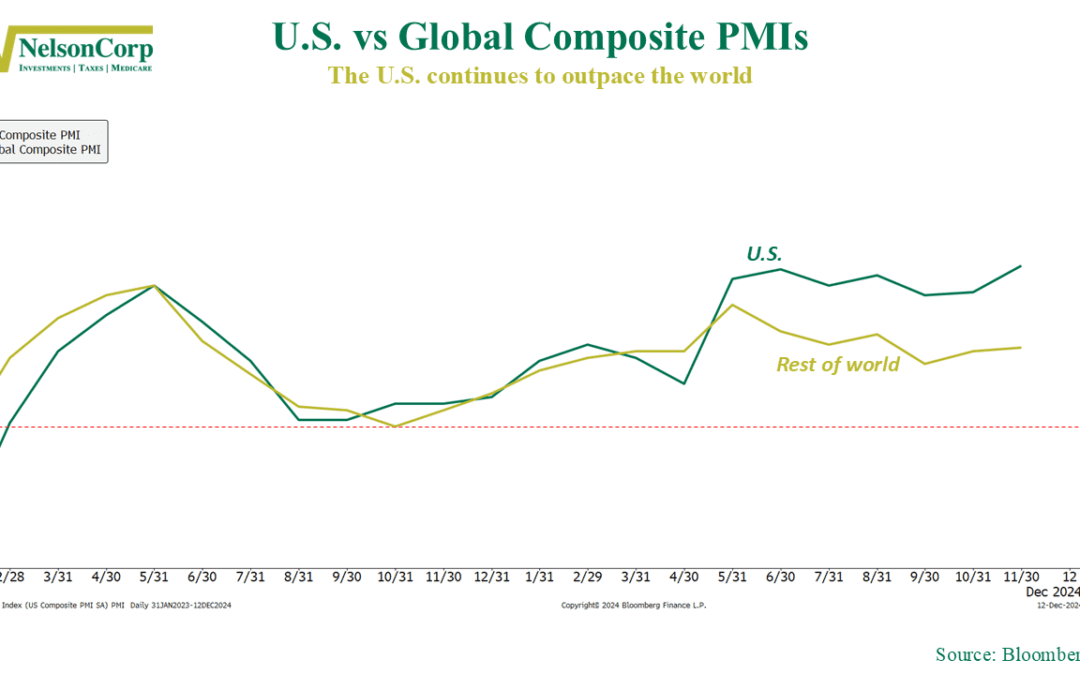
The United States is leading the pack in terms of global economic growth. It might surprise some, but the U.S. economy has remained resilient, growing faster than other countries—and the stock market has kept pace. To illustrate, our chart this week compares...
by NelsonCorp Wealth Management | Dec 6, 2024 | Chart of the Week
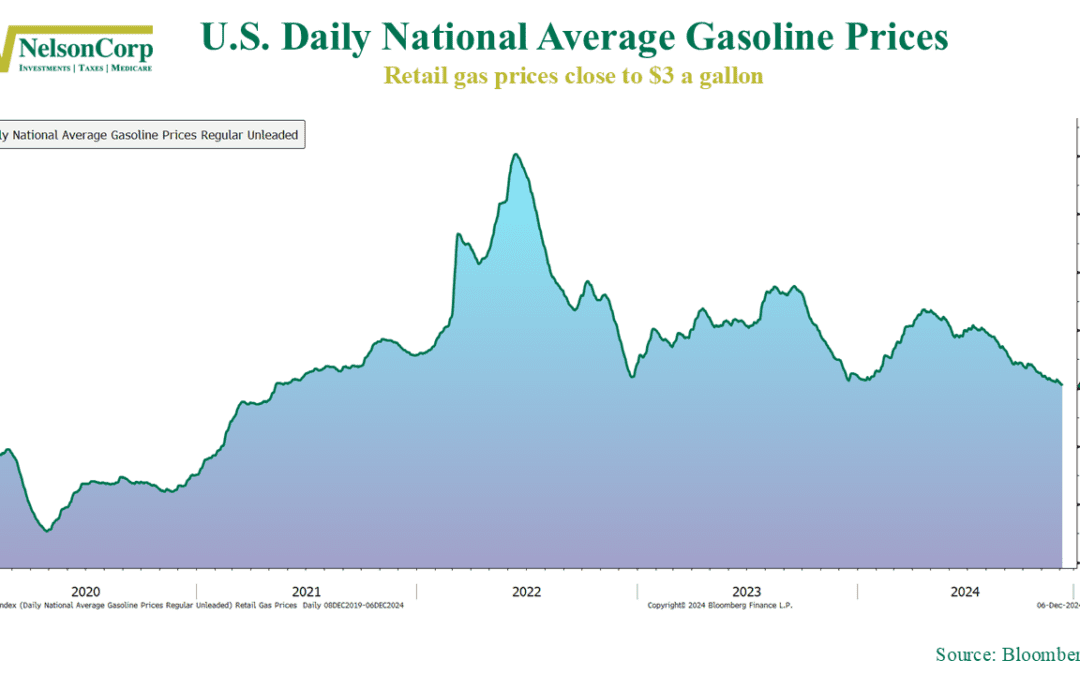
This week’s chart delivers some great news for drivers and shoppers alike: gas prices are dropping! According to data from the American Automobile Association, the national average price of regular unleaded gasoline has dipped to nearly $3 per gallon, the...
by NelsonCorp Wealth Management | Nov 29, 2024 | Chart of the Week
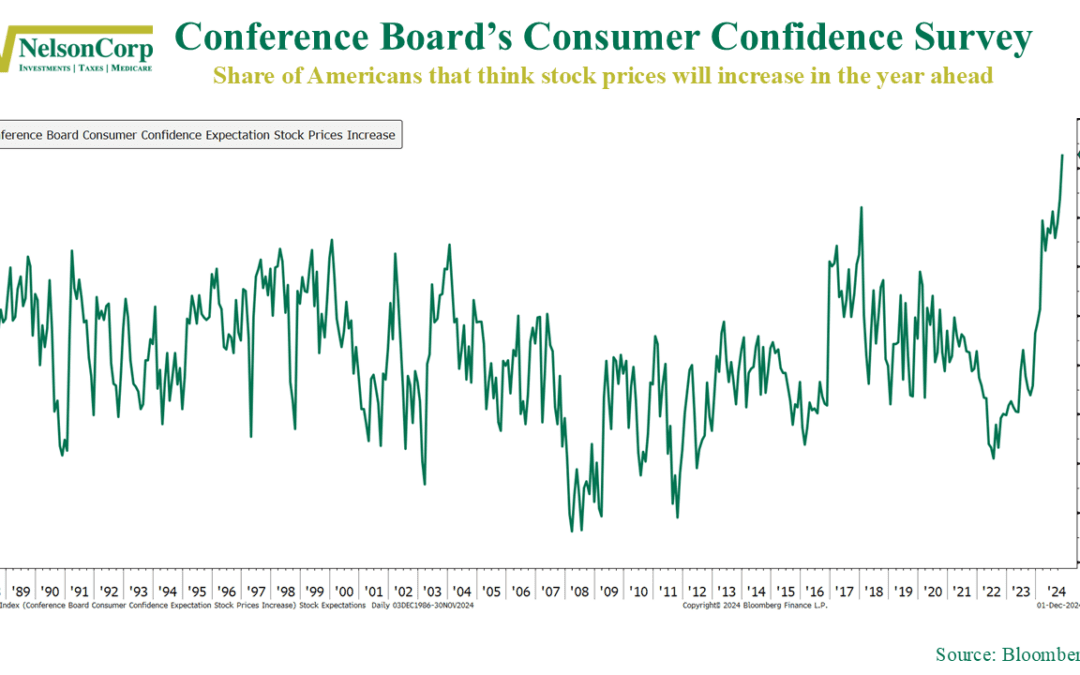
Americans are feeling confident in the stock market—and then some. As this week’s featured chart above shows, 56% of U.S. consumers now believe stock prices will rise in the next year, according to the Conference Board. This surge in optimism is the highest...
by NelsonCorp Wealth Management | Nov 22, 2024 | Chart of the Week
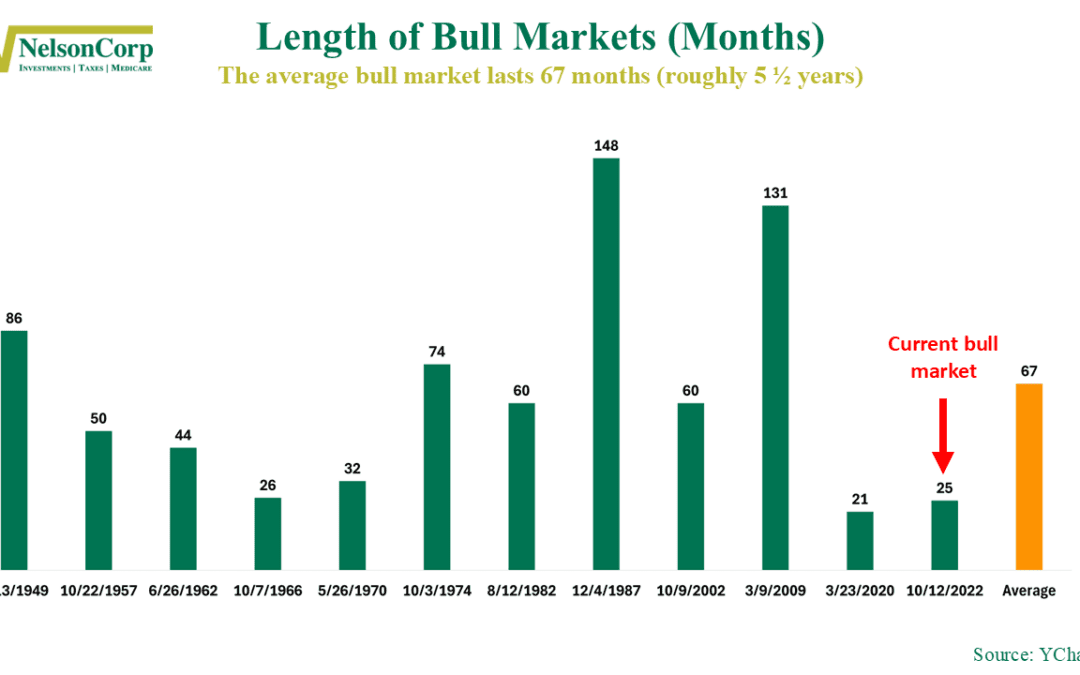
The stock market is in a “bull market.” A bull market, for those unfamiliar with the term, is defined as a sustained period of stock market gains where prices rise by 20% or more from a recent low. One question we often hear is: how long do bull markets...
