by NelsonCorp Wealth Management | May 10, 2024 | Chart of the Week
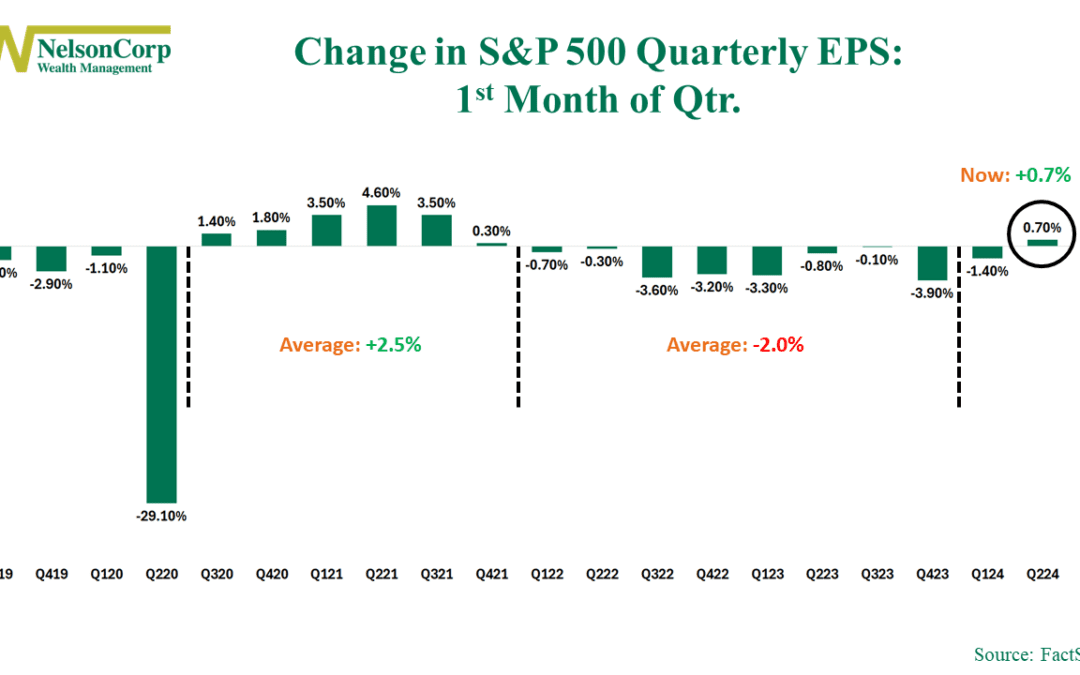
April brought a surprising turn of events in the world of stock market forecasts: for the first time since 2021, stock analysts actually boosted their earnings per share (EPS) estimates for the current quarter. As our featured chart above shows, analysts...
by NelsonCorp Wealth Management | May 3, 2024 | Chart of the Week
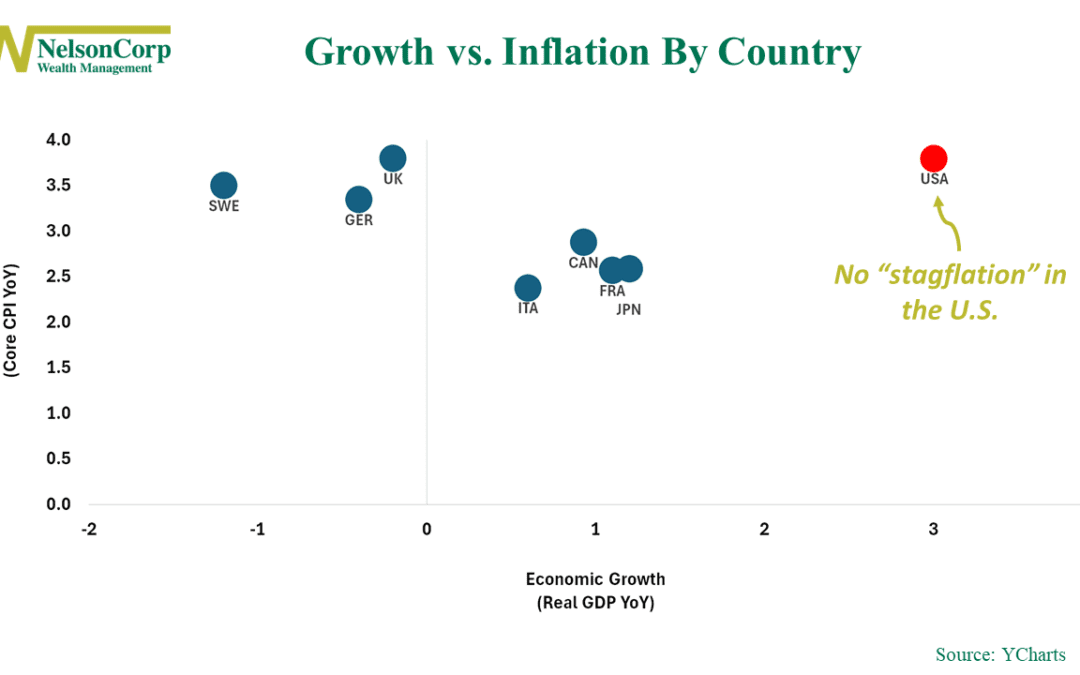
Lately, there’s been a buzz about something called “stagflation” in the global economy. Stagflation happens when a country’s economy gets stuck in a slump with slow growth and high inflation – definitely not a good situation. But should...

by NelsonCorp Wealth Management | Apr 26, 2024 | Chart of the Week
Have you ever wondered how the stock market does during a presidential election year? Well, let’s take a look! This week’s chart shows how the Dow Jones Industrial Average, which is used as a representation of the stock market, typically performs over a...

by NelsonCorp Wealth Management | Apr 19, 2024 | Chart of the Week
There’s this saying on Wall Street that copper is the commodity with a PhD in economics. Why? Because it’s an industrial metal that sees its demand wax and wane with economic growth. The higher the growth, the higher the demand for copper, and vice versa. Well,...

by NelsonCorp Wealth Management | Apr 12, 2024 | Chart of the Week
This week’s big news was the release of the March CPI (consumer inflation) numbers. As feared, it came in hotter than expected. The year-over-year change in the CPI picked up to 3.48% last month. As you can see on the chart below, it’s been stuck in a narrow range...

by NelsonCorp Wealth Management | Apr 5, 2024 | Chart of the Week
We closed out the first quarter last week—and it was a good one. Over the first three months of the year, the S&P 500 stock Index rose 10.16%. The three months before that, it was up 11.24%. That’s back-to-back quarterly gains of 10% or more for the first...
