by NelsonCorp Wealth Management | Jun 21, 2024 | Chart of the Week
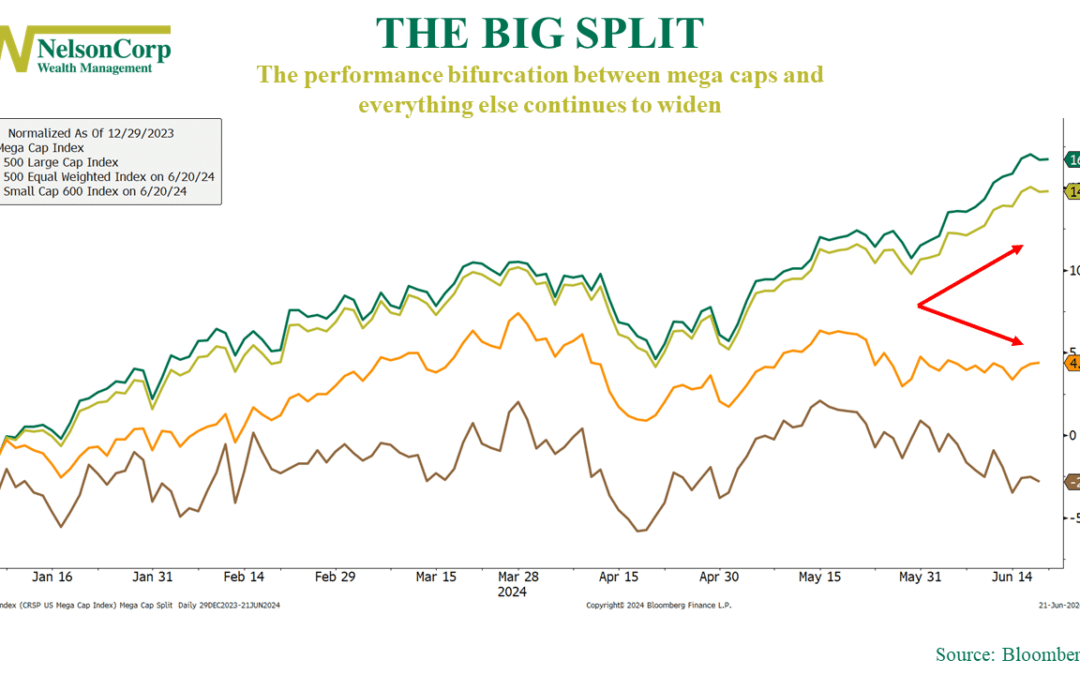
There’s a growing divide in the United States. No, I’m not talking about the Grand Canyon in Arizona. Or politics. But rather Wall Street, in the stock market, and it’s being driven by mega-cap stocks. This week’s featured chart highlights the performance of...
by NelsonCorp Wealth Management | Jun 14, 2024 | Chart of the Week
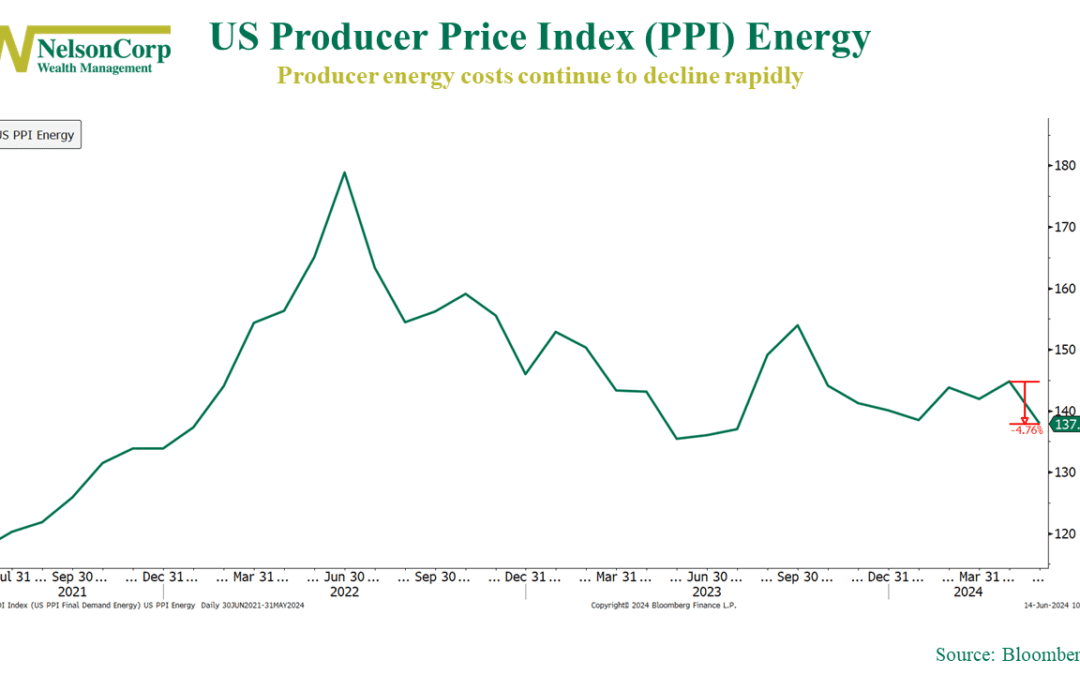
We saw a lot of good news on the inflation front this week. The May Consumer Price Index (CPI) showed a broad cooling in prices, and then we found out that the Producer Price Index (PPI) unexpectedly declined by the most in seven months last month. The big...
by NelsonCorp Wealth Management | Jun 7, 2024 | Chart of the Week
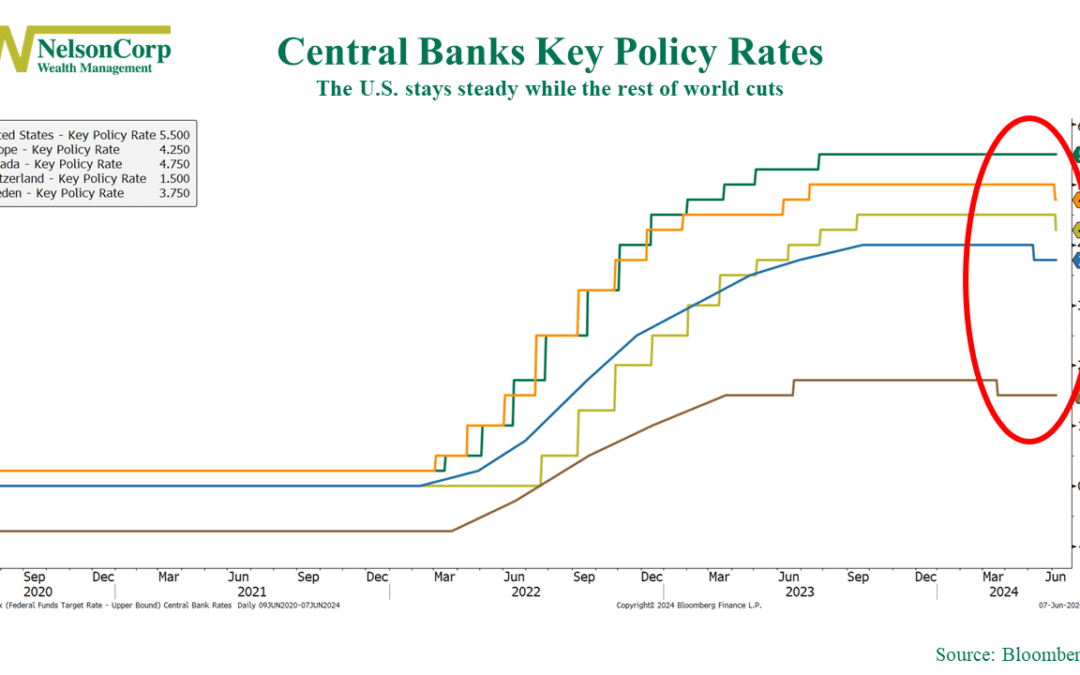
Hikes are out, and cuts are in. That’s the direction the world’s Central Banks have been moving lately. This week, the European Central Bank and Canada joined Sweden and Switzerland in cutting their key policy interest rates. That makes four major...

by NelsonCorp Wealth Management | May 31, 2024 | Chart of the Week
If you were to ask a random person on the street their thoughts on inflation, they’d likely say, “It’s ridiculously high right now.” But ask that same question to an economist, and you’d probably get a different answer. They’d say something like, “It’s come down...
by NelsonCorp Wealth Management | May 24, 2024 | Chart of the Week
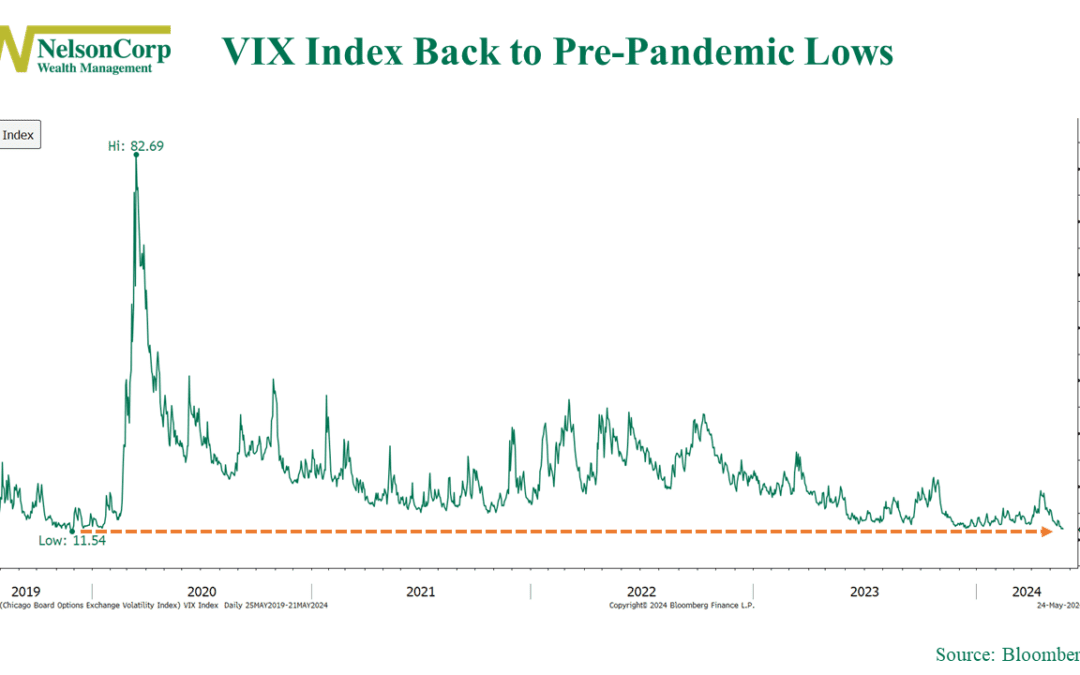
This week’s chart highlights a significant milestone for stock investors: the VIX Index is back to pre-pandemic lows. The VIX, often called the “fear gauge,” measures market volatility implied from S&P 500 options. When it rises, it means investors expect...

by NelsonCorp Wealth Management | May 17, 2024 | Chart of the Week
The U.S. stock market reached a major milestone last week as the Dow Jones Industrial Average crossed the 40,000 mark for the first time ever. Looking at the chart, you can see that the Dow first crossed 20,000 in January 2017. So, it took a little over 7 years...
