
by NelsonCorp Wealth Management | May 20, 2022 | Chart of the Week
You’ve heard the saying: Don’t start something you can’t finish. Well, it appears that U.S. homebuilders are not heeding that advice. As our featured chart of the week above shows, the gap between the number of new home constructions started and the number of...

by NelsonCorp Wealth Management | May 13, 2022 | Chart of the Week
This week’s chart looks at what is called the “term premium” on U.S. government bonds. A term premium is the extra return bond buyers demand to hold a long-term bond instead of a series of short-term bonds. All else equal, term premiums on longer-term bonds...
by NelsonCorp Wealth Management | May 6, 2022 | Chart of the Week
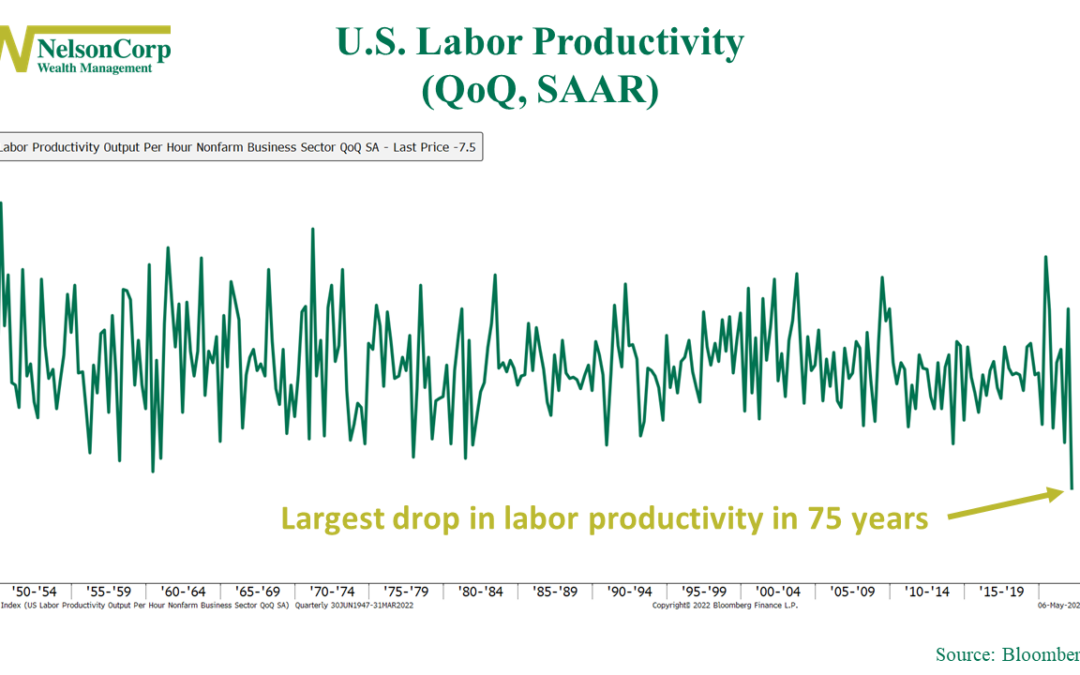
U.S. workers got a lot less productive in the first quarter of this year. According to the latest figures from the Labor Department, nonfarm business employee output per hour—or simply labor productivity—dropped by a 7.5% annual rate from the previous quarter,...
by NelsonCorp Wealth Management | Apr 29, 2022 | Chart of the Week
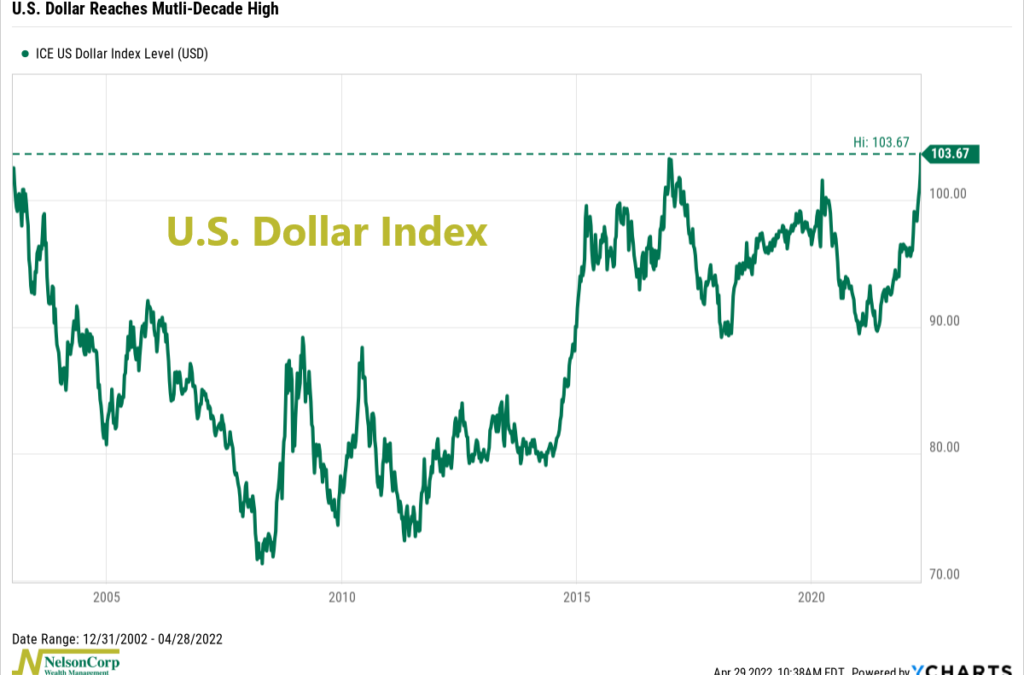
Listen closely, and you might hear chants of “King Dollar!” echoing faintly in the background. Why? Because the stealthy story unfolding in the financial markets over this past month has been the surge in the value of the U.S. dollar. As our chart of the week...
by NelsonCorp Wealth Management | Apr 22, 2022 | Chart of the Week
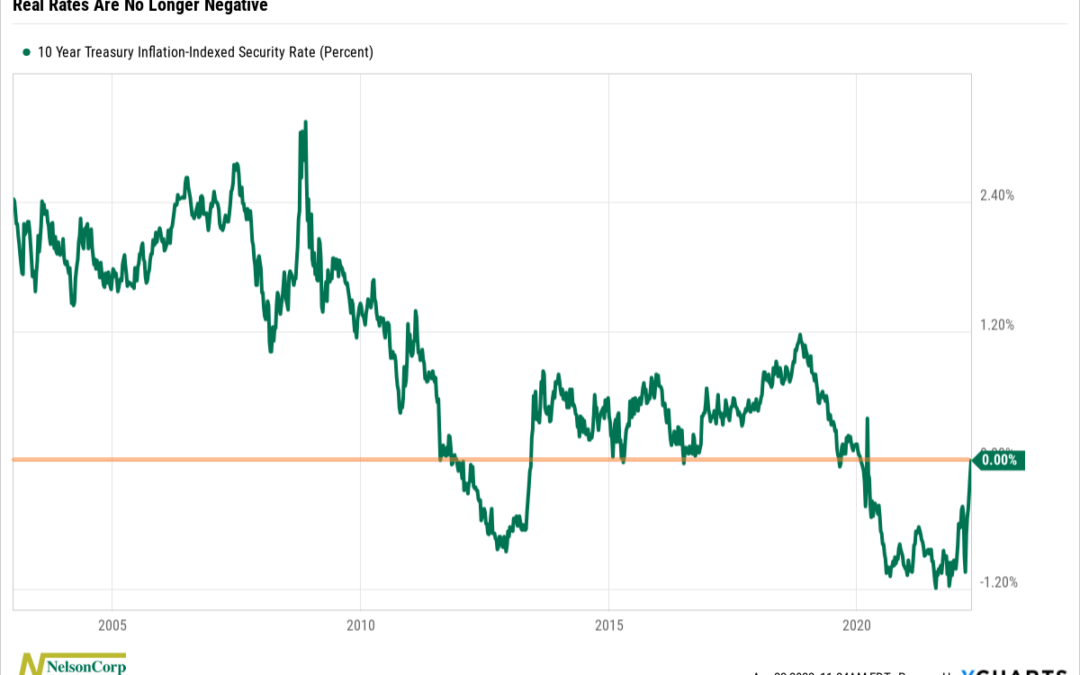
We’ve seen financial conditions tighten up a bit already during this new Fed tightening cycle, but so far, it hasn’t had too much of an effect on the real economy. However, that might be about to change. For example, our chart of the week above shows that real...
by NelsonCorp Wealth Management | Apr 15, 2022 | Chart of the Week
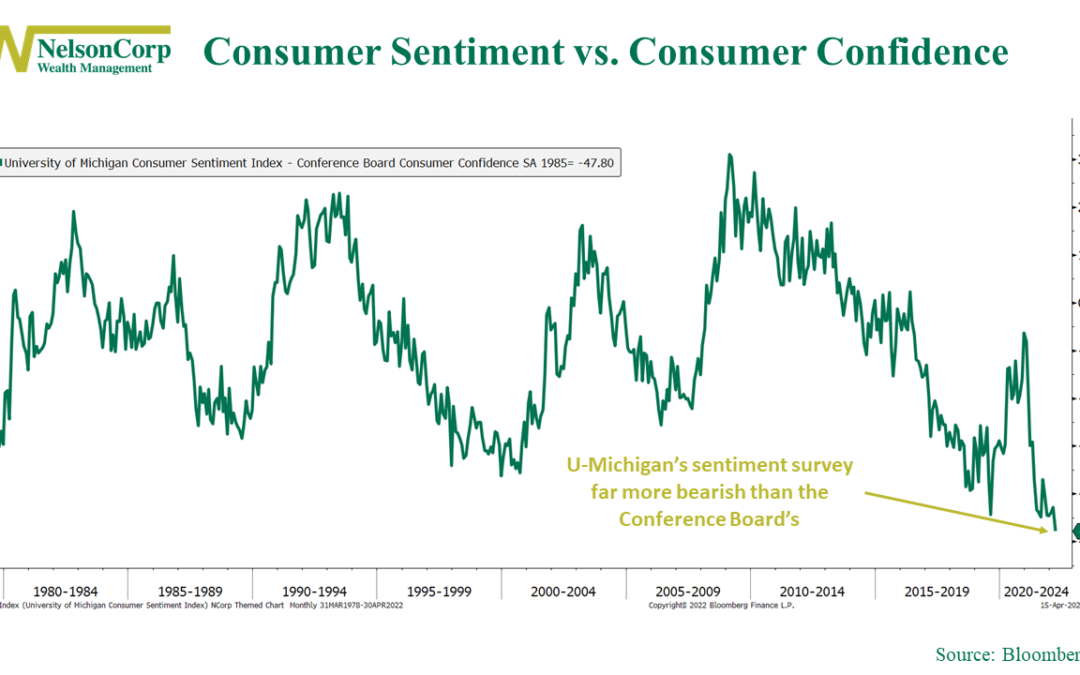
When it comes to measuring consumer confidence, the two best-known surveys are published by the University of Michigan and the Conference Board. Both are widely followed and respected, but they measure slightly different things. The Conference Board’s survey...
