by NelsonCorp Wealth Management | Apr 8, 2022 | Chart of the Week
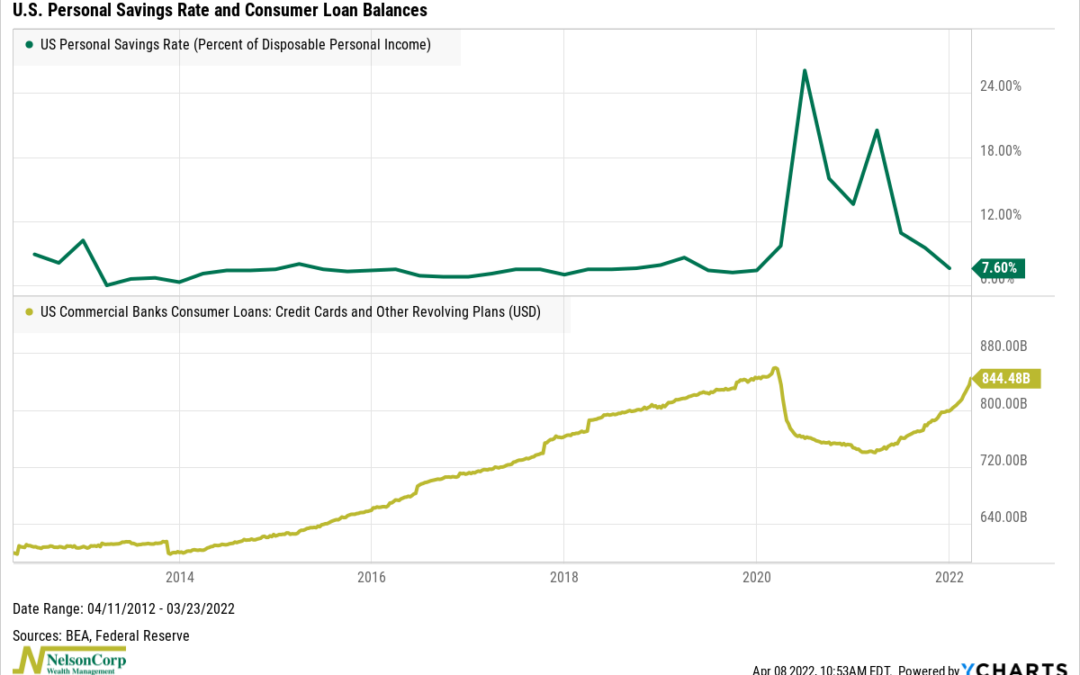
One of the weird things about the 2020 recession was that household balance sheets in the U.S. actually improved quite a bit. Not only did the personal savings rate skyrocket, but credit card debt plummeted as well. A combination of fiscal and monetary support...
by NelsonCorp Wealth Management | Apr 1, 2022 | Chart of the Week
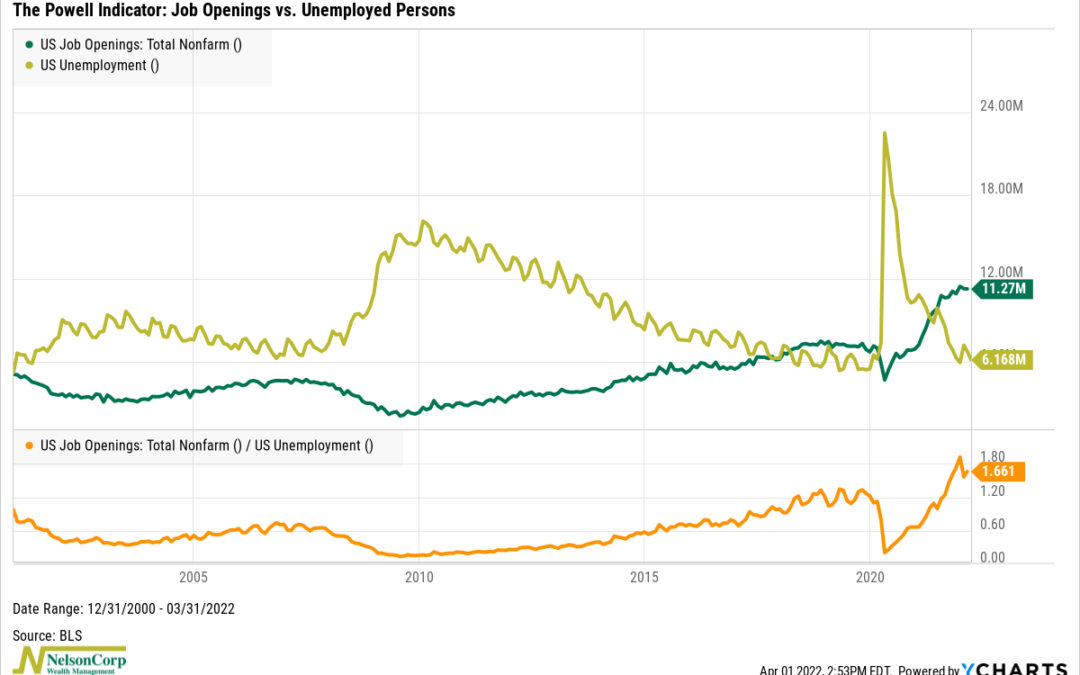
The U.S. job market reminds me of the way the character Mugatu describes the male fashion model Hansel in the 2001 film Zoolander. “So hot right now.” Currently, there are around 11.3 million open jobs in the United States, compared to just 6.2...
by NelsonCorp Wealth Management | Mar 25, 2022 | Chart of the Week
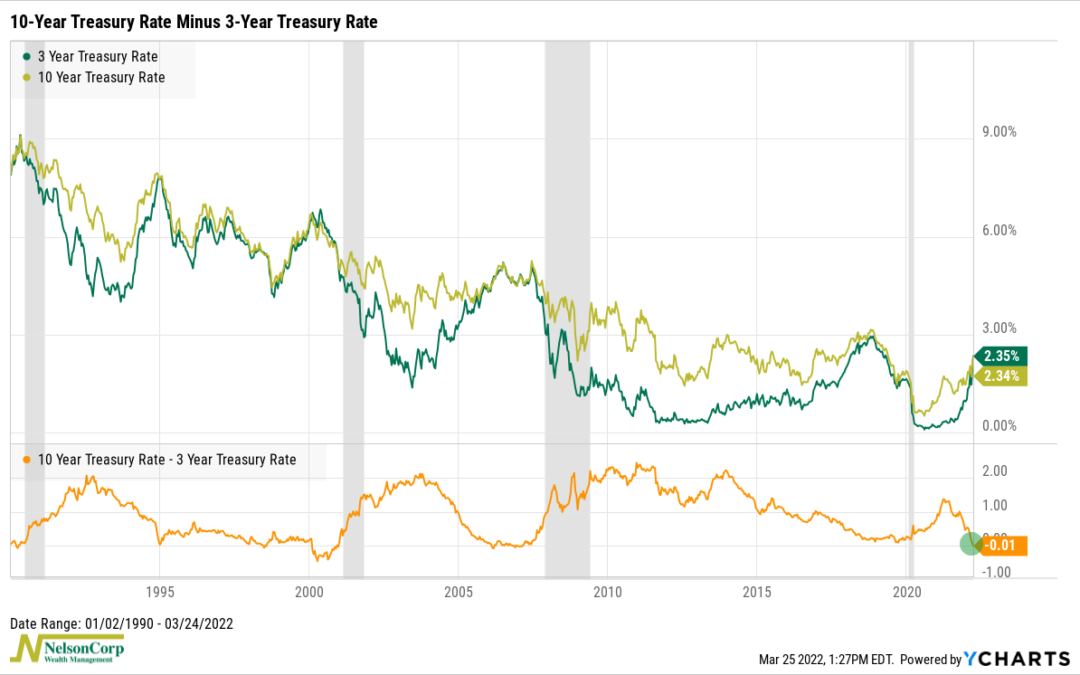
Something weird happened in the bond market this week. The interest rate on the 3-year U.S. Treasury bond (2.35%) surpassed the rate of the longer-dated 10-year bond (2.34%). In the finance world, we call this an inverted yield curve. Usually, it’s the other...
by NelsonCorp Wealth Management | Mar 18, 2022 | Chart of the Week
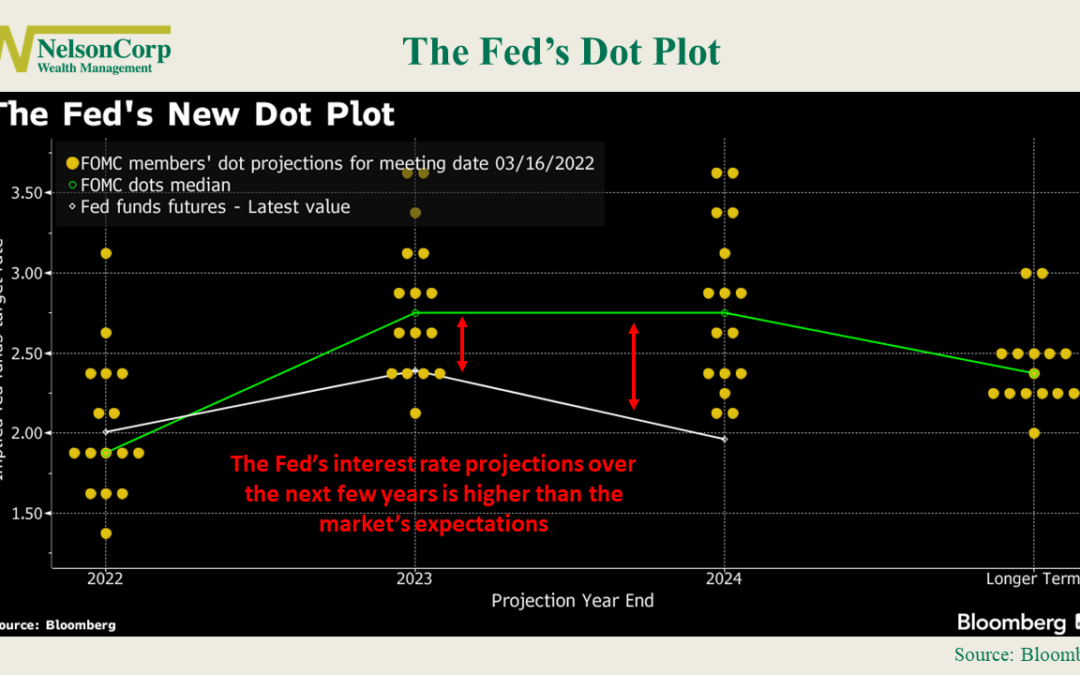
The big news this week came from the Federal Reserve. In an 8-1 vote, the Fed’s policymakers decided to raise their benchmark interest rate by a quarter percentage point, the first increase since 2018. Additionally, they announced their plan to raise rates at...
by NelsonCorp Wealth Management | Mar 11, 2022 | Chart of the Week
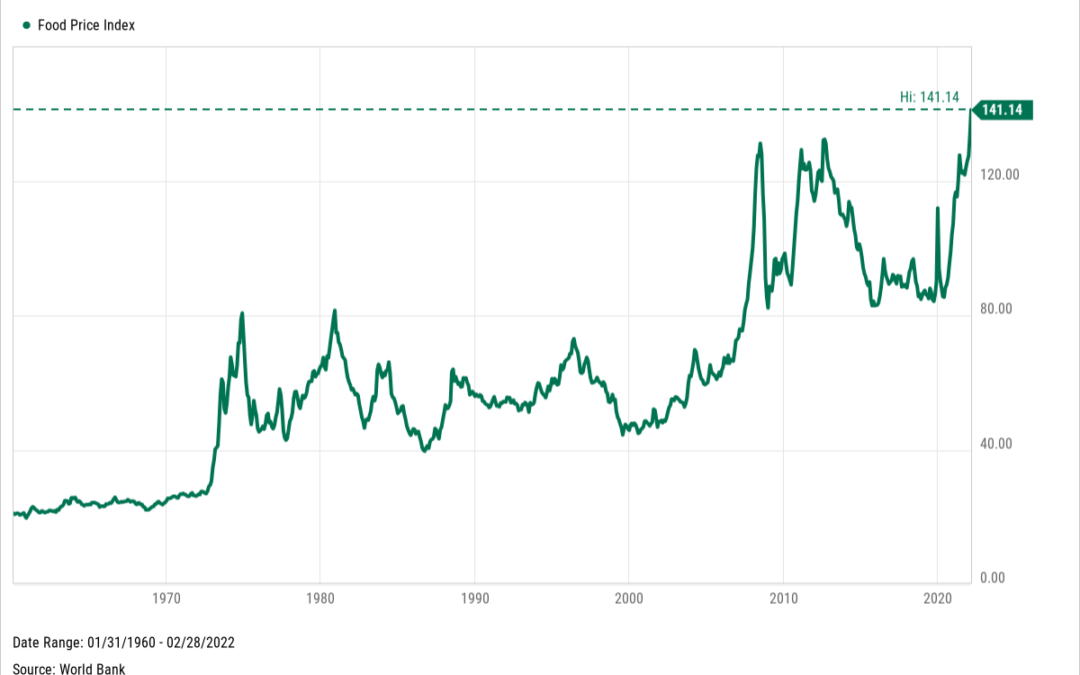
Our featured chart this week shows that groceries are getting more expensive worldwide, with food costs jumping to a record high last month. The World Bank’s Food Price Index, a measure of global food prices, climbed 5.68% from last month and 21.01% from a year...
by NelsonCorp Wealth Management | Mar 4, 2022 | Chart of the Week
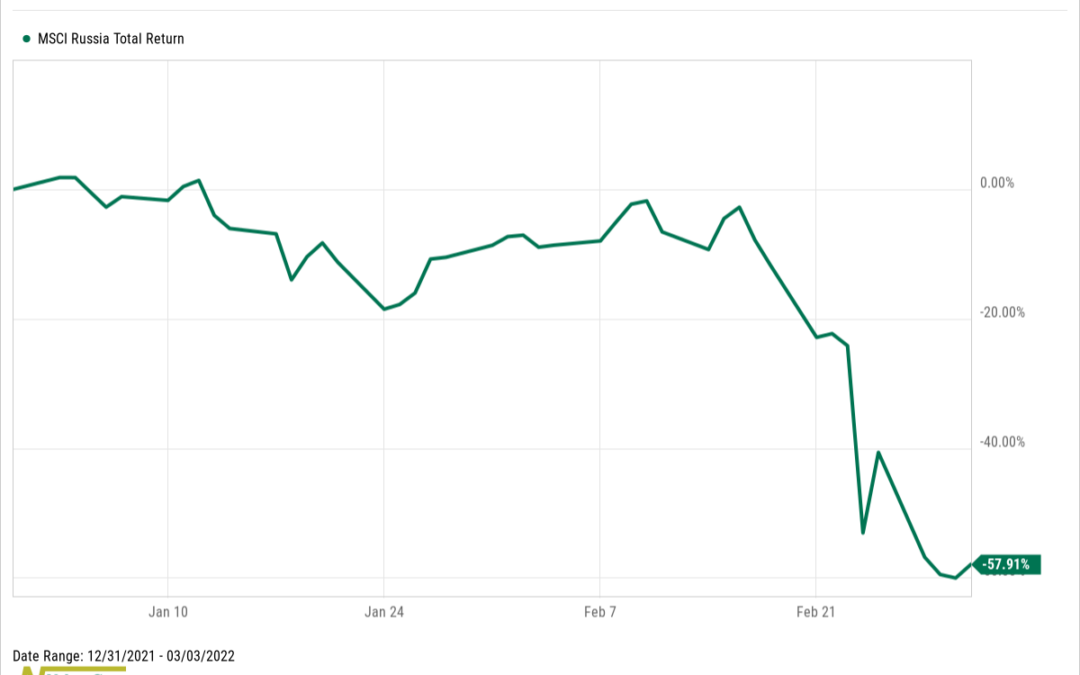
For this week’s Chart of the Week, we show the return of the MSCI Russia Index, a broad gauge of the Russian stock market. Due to crippling sanctions from the western world, the Russian stock market is now effectively uninvestable and illiquid. As you can see...
