by NelsonCorp | Jan 23, 2026 | Chart of the Week
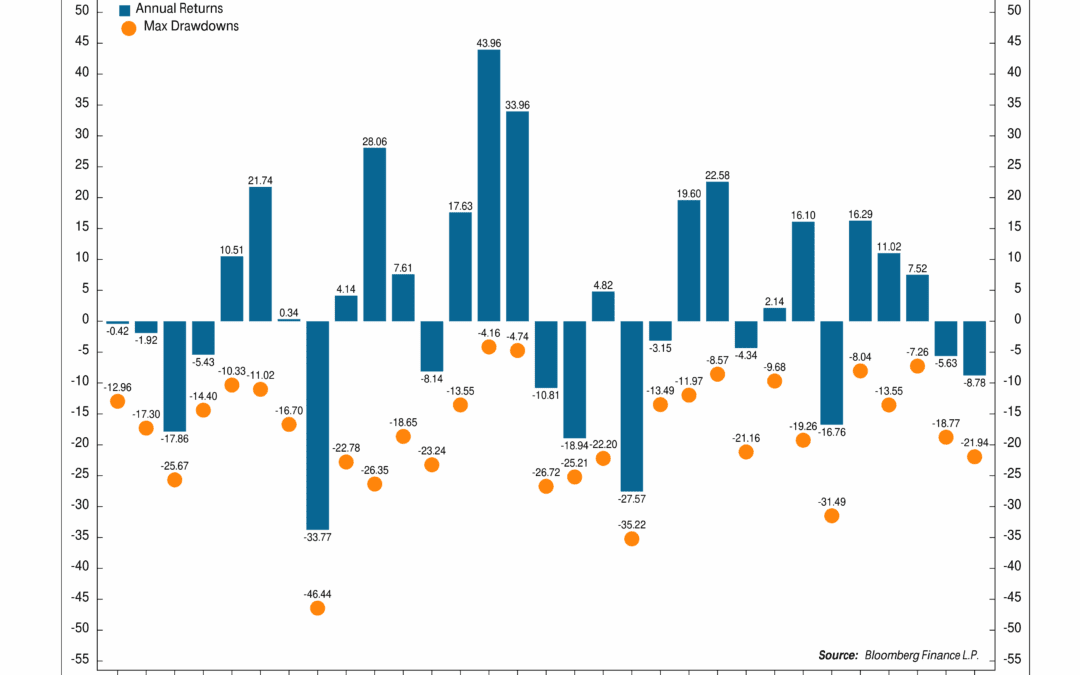
This week’s chart looks at how the Dow Jones Industrial Average has typically behaved during midterm election years. There have been 31 midterm elections since 1902. Each blue bar on the chart represents the annual return for that midterm year, while the orange...
by NelsonCorp | Jan 16, 2026 | Chart of the Week
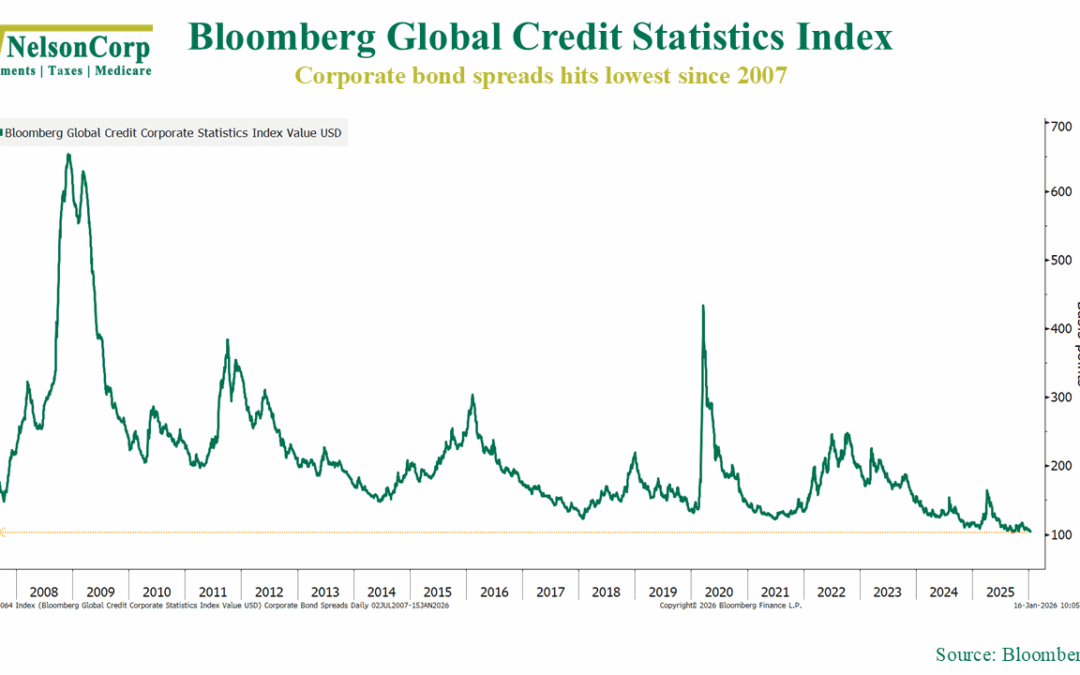
How do we know when investors are gearing up to embrace risk? We look at credit spreads, the featured metric in this week’s chart shown above. What are credit spreads? Simply put, they are the extra interest investors earn for lending money to companies instead...
by NelsonCorp | Jan 9, 2026 | Chart of the Week
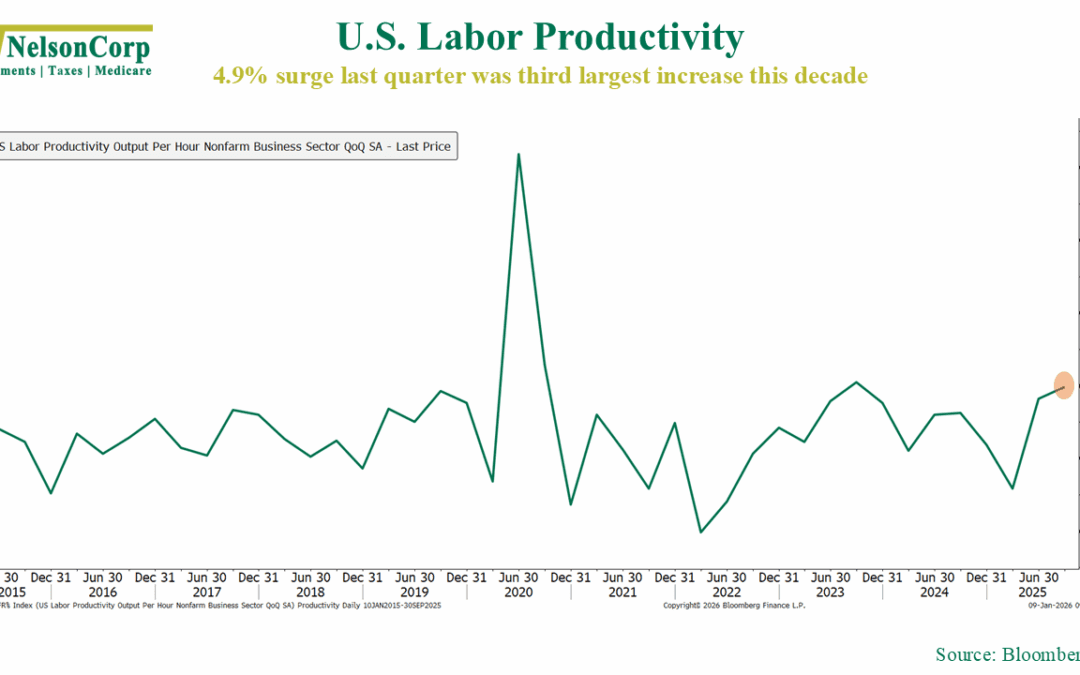
Sometimes we get an economic report that really jumps off the page. That was the case with this week’s productivity data. According to the BLS, labor productivity surged at a 4.9% annualized pace in the third quarter, the fastest increase in two years....
by NelsonCorp | Jan 2, 2026 | Chart of the Week
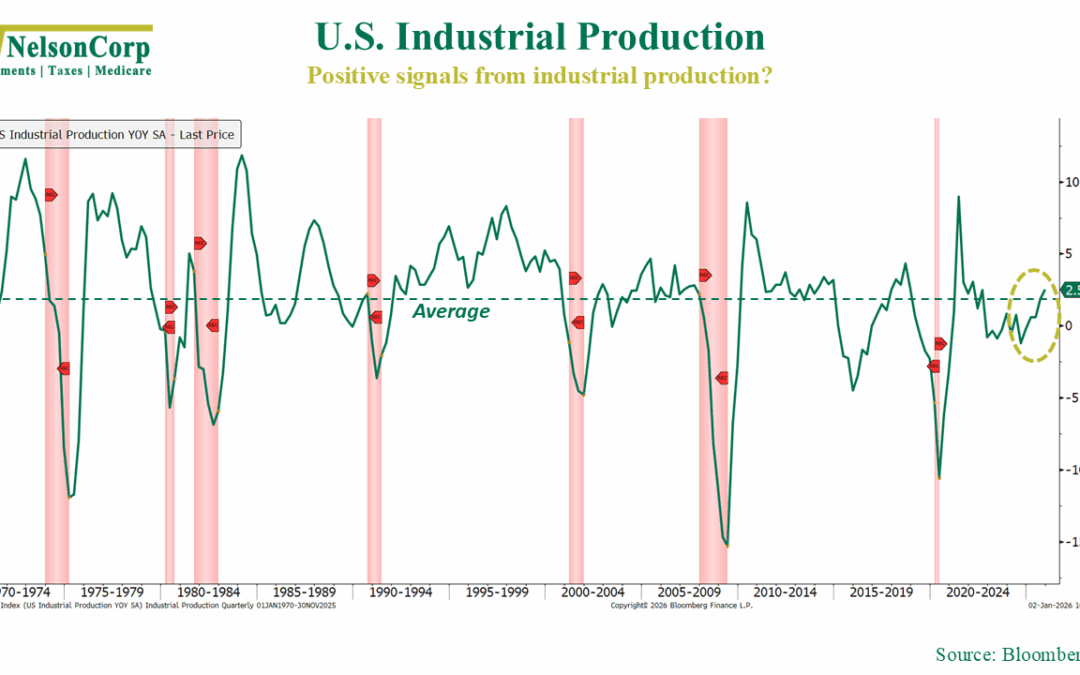
Heading into the new year, one question we get a lot is: How is the economy doing? Now, it can be hard to answer a question like that, because what one means by “the economy” can be different for different people. Are we talking about economic growth?...
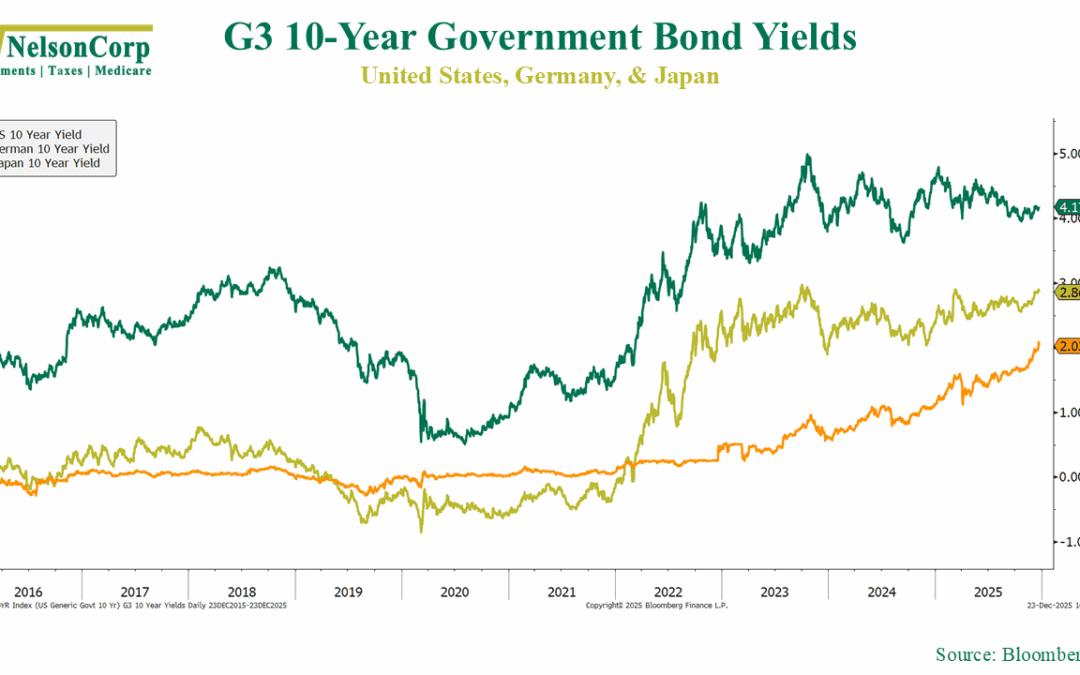
by NelsonCorp | Dec 26, 2025 | Chart of the Week
We got some encouraging economic news this week. In the third quarter, real GDP grew at a 4.3% annualized pace, the fastest growth in two years and well above expectations. That strength is welcome, but it also helps explain something else we’ve been living...
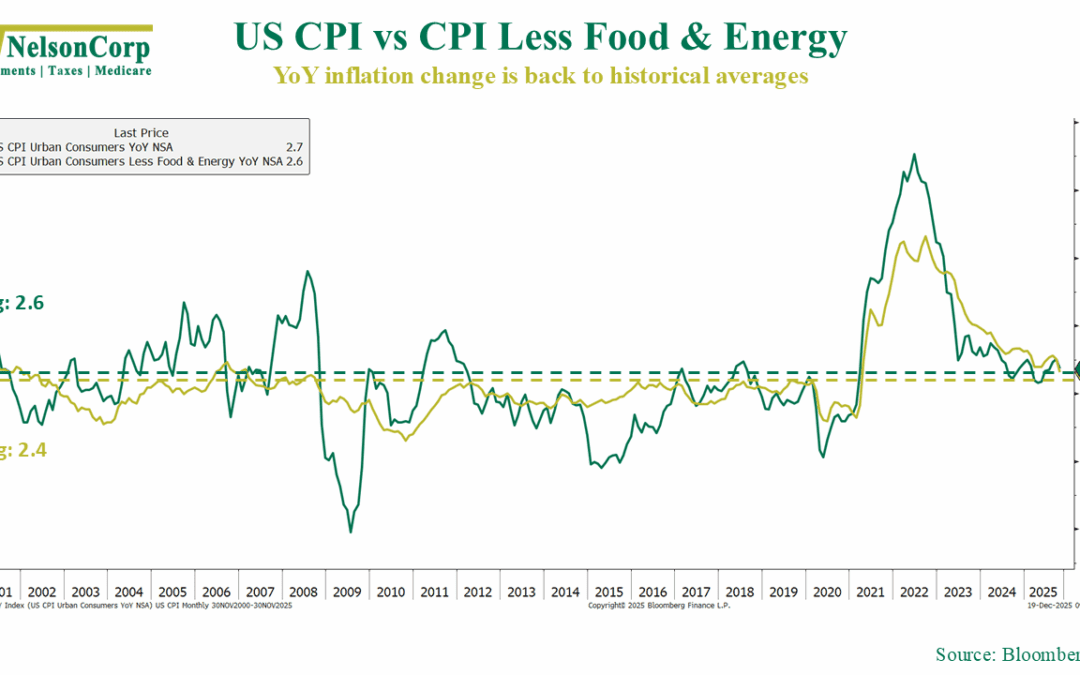
by NelsonCorp | Dec 19, 2025 | Chart of the Week
The big news in the finance world this week was the release of the November inflation numbers. On the surface, it was a good report. The headline Consumer Price Index (CPI) posted a 2.7% y/y gain, down from 3% in September. And if we back out food and energy...