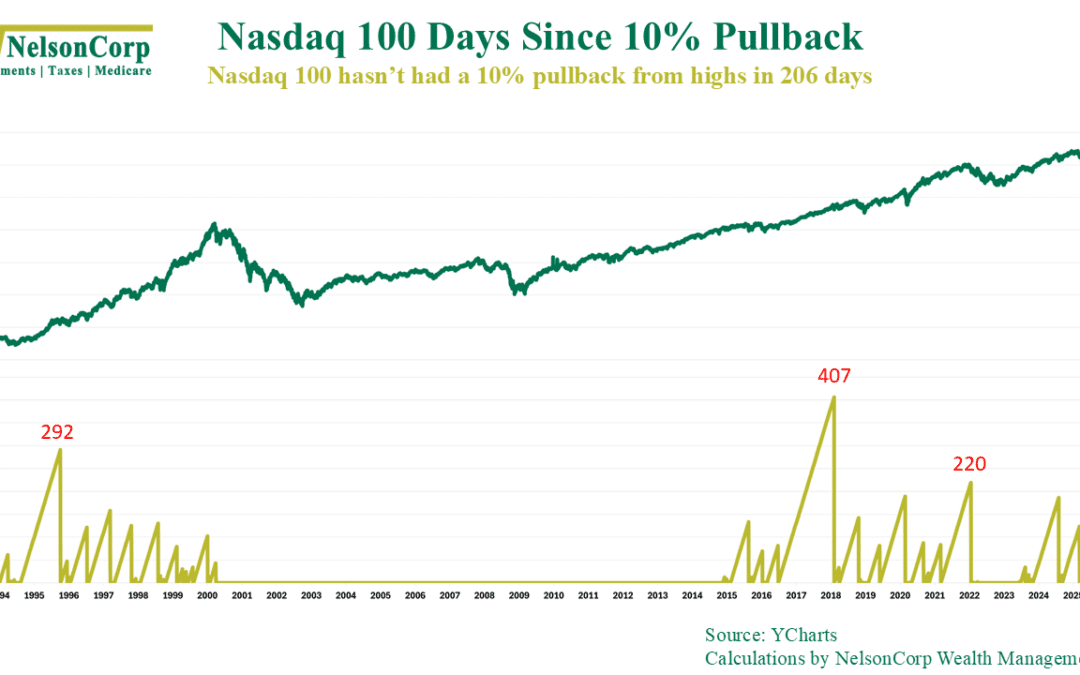
by NelsonCorp | Mar 6, 2026 | Chart of the Week
It’s been a while since we’ve seen a meaningful pullback in the stock market. Specifically, our chart above shows that it’s been 206 days since the last time the Nasdaq-100—the tech-heavy U.S. stock index—declined more than 10% from a high, the fourth longest...
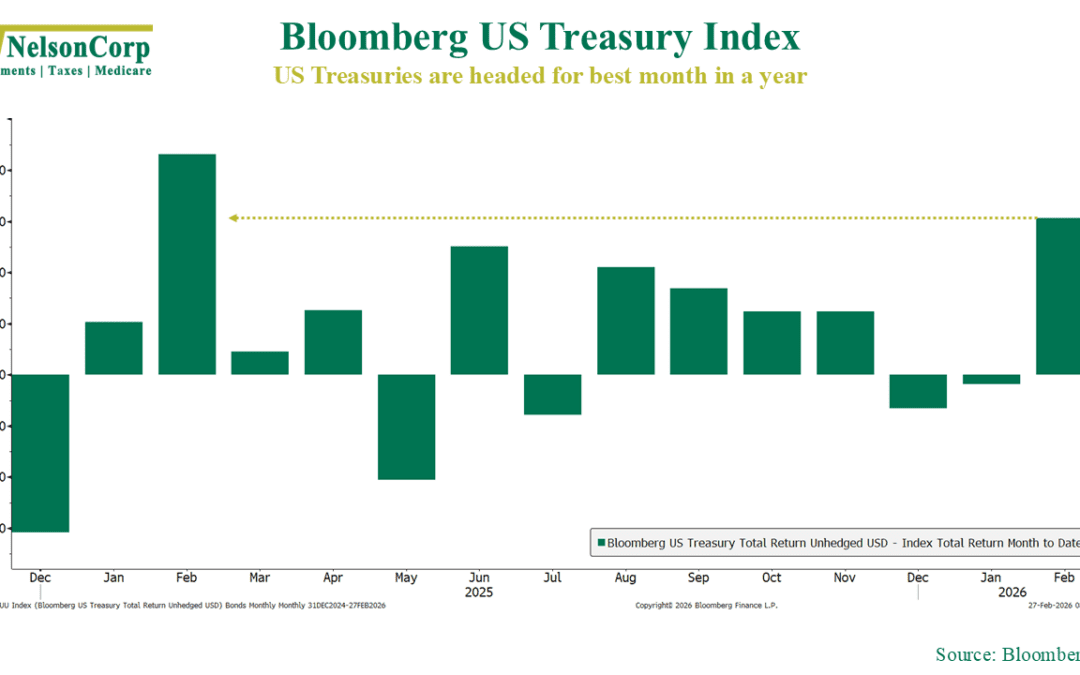
by NelsonCorp | Feb 27, 2026 | Chart of the Week
Despite all the consternation and hoopla surrounding the stock market, AI disruption, and all the rest, one asset class actually had a pretty good month: bonds. U.S. Treasury bonds, in particular, did well in February. As our Chart of the Week shows, the...
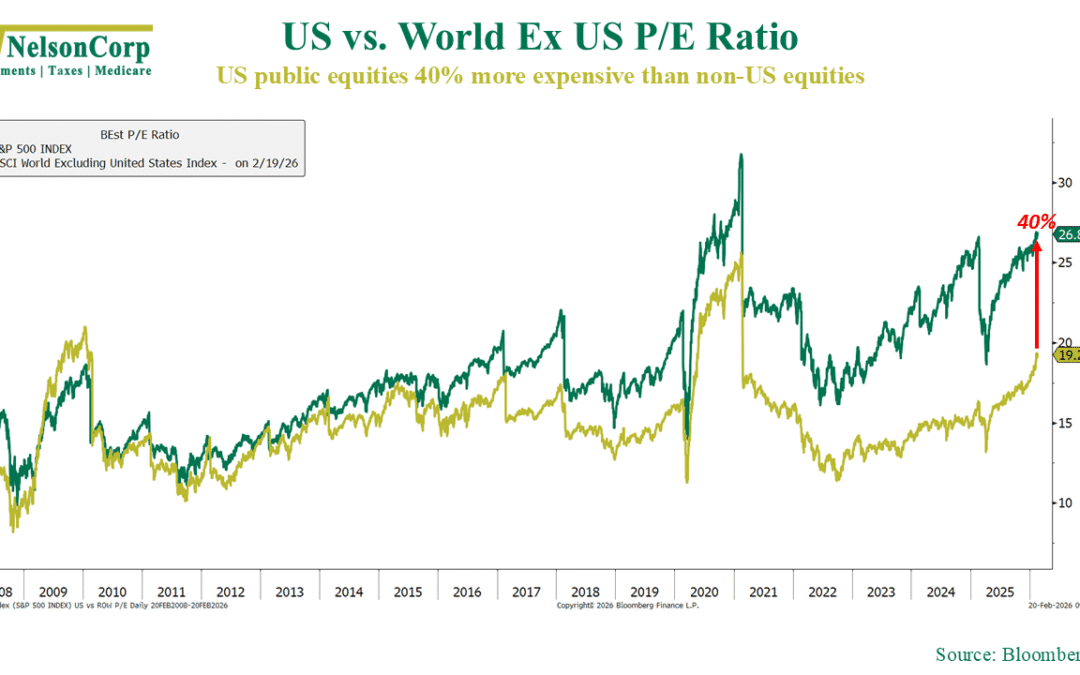
by NelsonCorp | Feb 20, 2026 | Chart of the Week
Over the last decade, investing has often felt like “just own U.S. stocks and move on.” This week’s chart shows why. After the Global Financial Crisis, U.S. and international stocks were valued pretty similarly. But then large-cap tech took off. Earnings were...
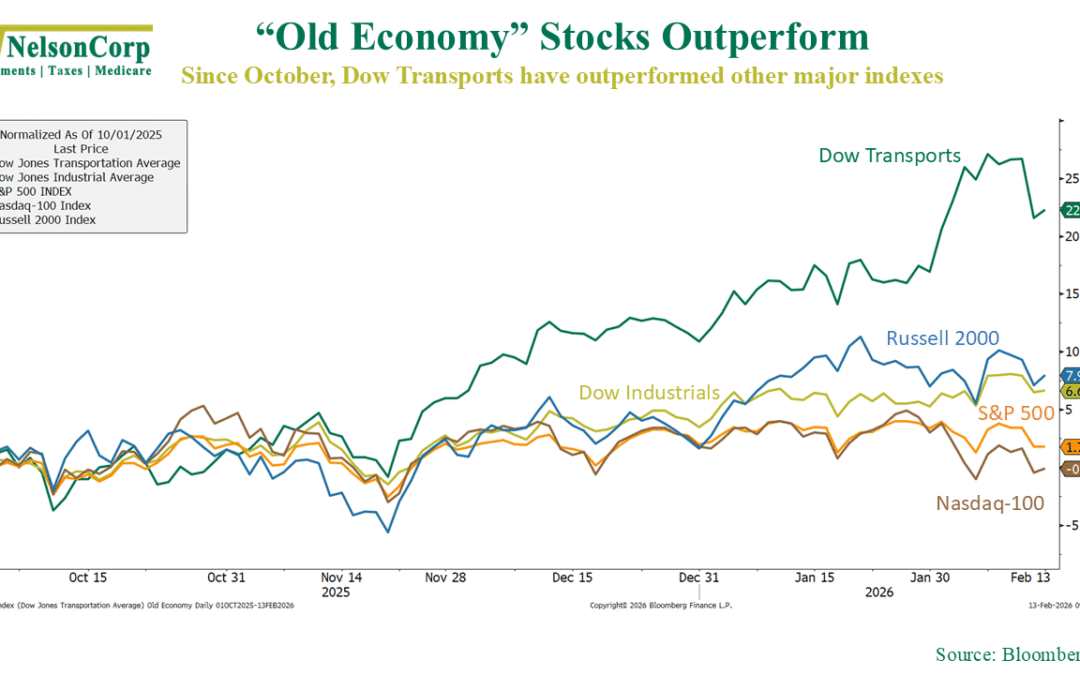
by NelsonCorp | Feb 13, 2026 | Chart of the Week
Over the past few months, we’ve seen an interesting shift happening in markets. As this week’s chart shows, the so-called “old economy” stocks have taken the lead. Since early October, the Dow Jones Transportation Average has surged more than 20%, decisively...
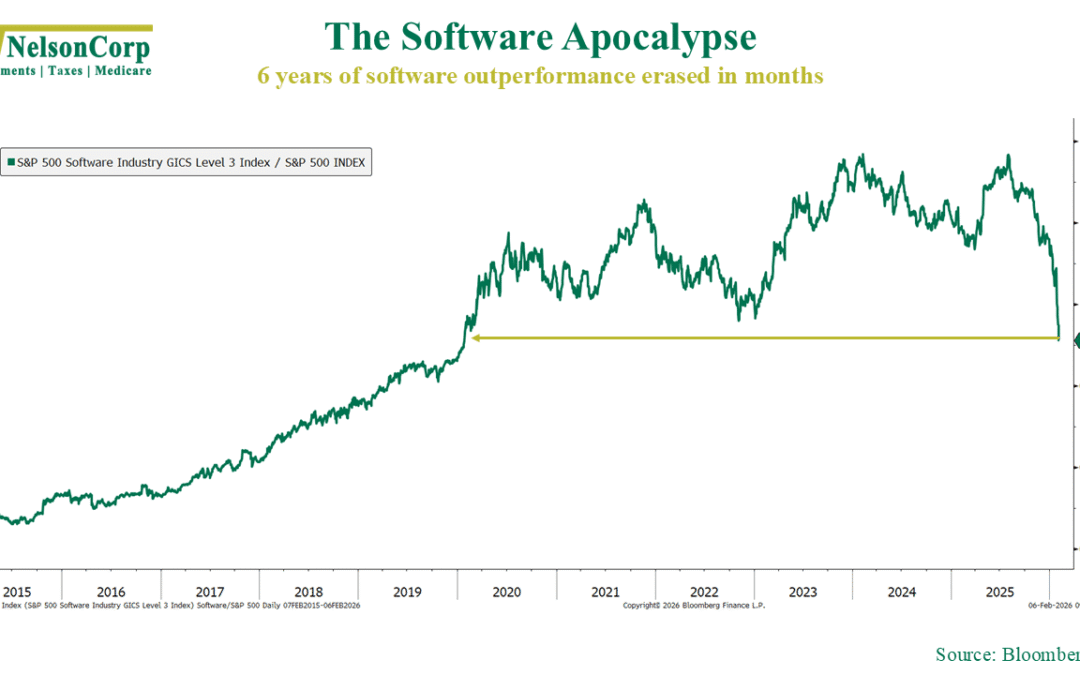
by NelsonCorp | Feb 6, 2026 | Chart of the Week
It was a rough week on Wall Street for technology stocks, and software took the brunt of it. This week’s chart shows the relative performance of the S&P 500 Software sector compared to the broader S&P 500. It’s a brutal picture. Nearly six years of...
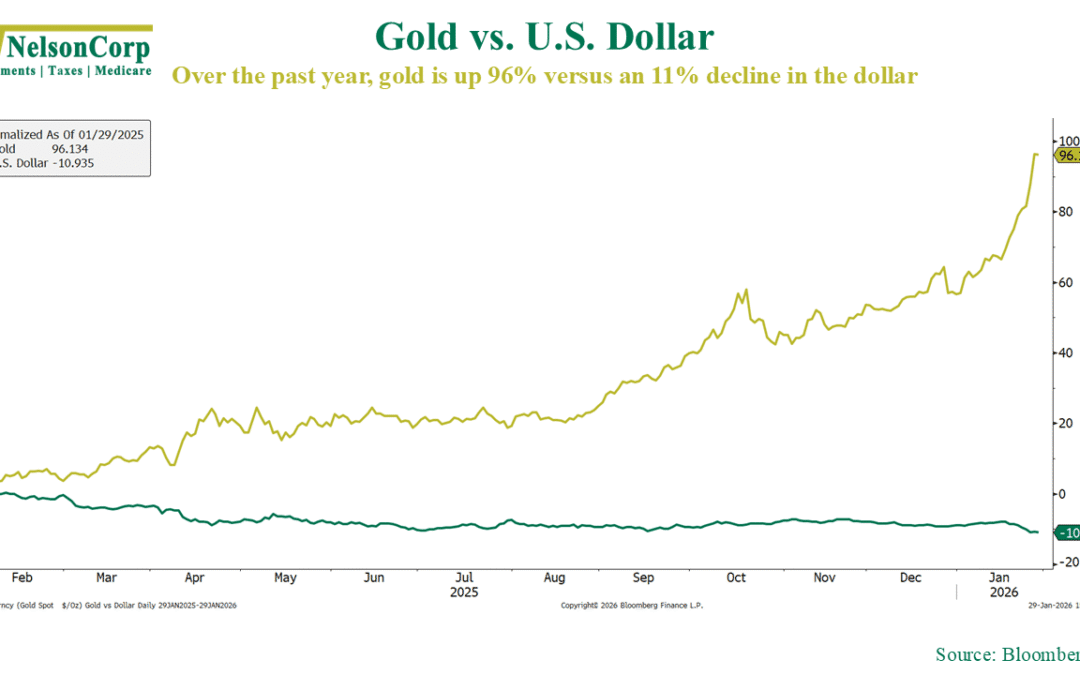
by NelsonCorp | Jan 30, 2026 | Chart of the Week
Gold has been on an absolute heater lately. The dollar? Not so much. That’s the message from this week’s chart, shown above, which compares the cumulative return of gold to the U.S. dollar over the past year. As you can see, gold is up more than 90% over the...