by NelsonCorp Wealth Management | Sep 10, 2020 | Chart of the Week
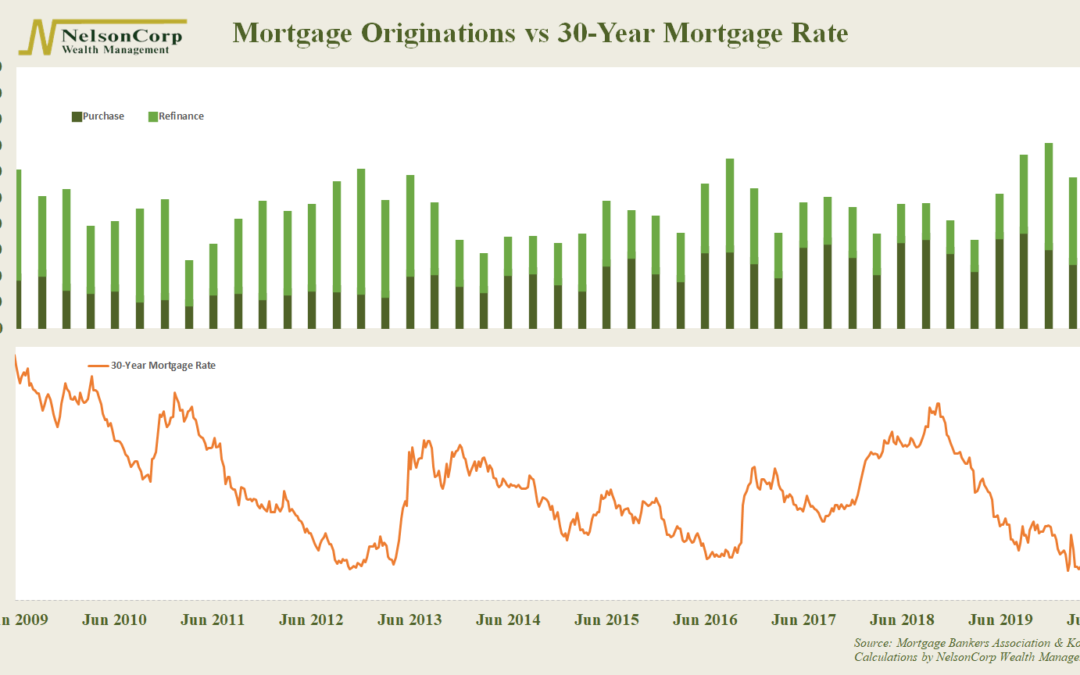
The mortgage market is on a tear in 2020. Despite a stumbling economy, lenders issued roughly $1 trillion in home loans last quarter. As our chart of the week shows, refinancings are driving this boom. Although new home purchases were down from a year ago,...
by NelsonCorp Wealth Management | Sep 3, 2020 | Chart of the Week
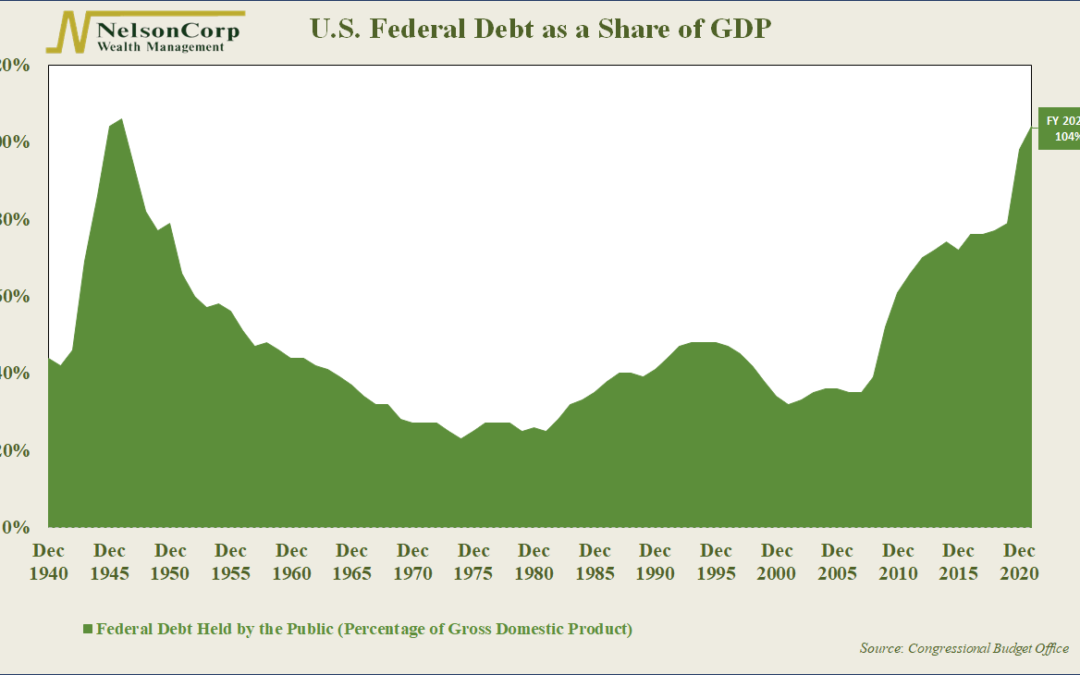
The U.S. federal debt exploded this year after a massive fiscal response to the coronavirus pandemic. By the end of June, total debt had ballooned to $20.5 trillion from $17.7 trillion at the end of March. This is a huge number. But it only represents one side...
by NelsonCorp Wealth Management | Aug 27, 2020 | Chart of the Week
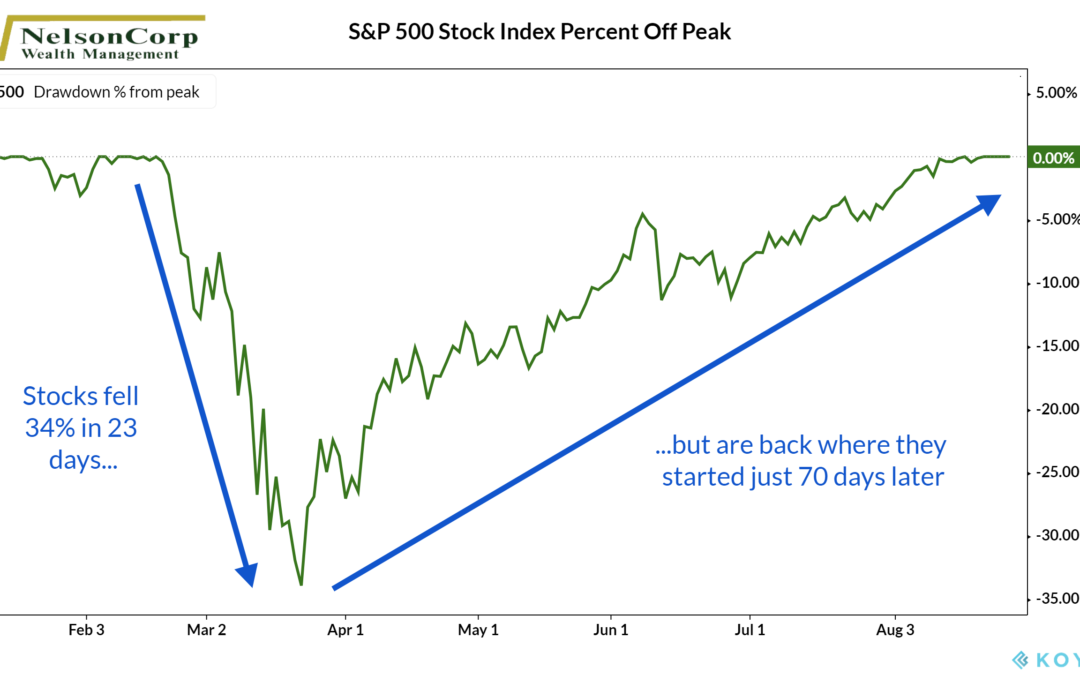
When the Covid-19 pandemic first became a reality in the United States earlier this year, it sent a shockwave through financial markets, leaving a path of destruction in its wake. The S&P 500 stock index fell nearly 34% in 23 days. But fast forward just 70...
by NelsonCorp Wealth Management | Mar 30, 2020 | Chart of the Week
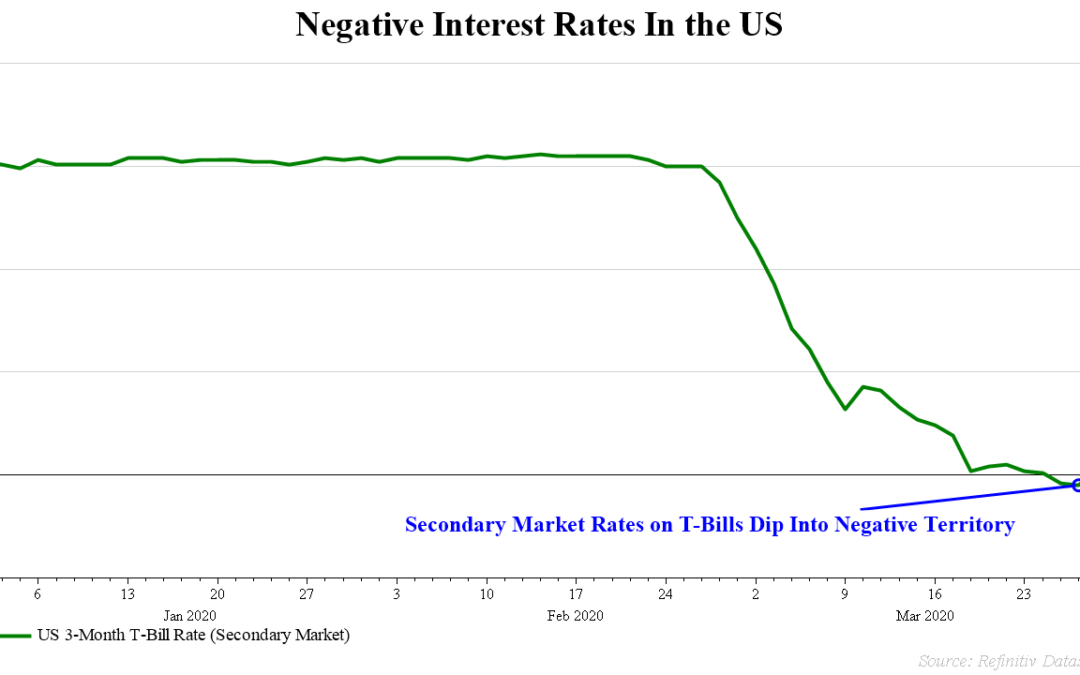
It used to be taught in finance class that nominal interest rates can’t go lower than zero, at least theoretically, because people can always just hold cash. However, in recent history, several economies around the world have seen the rates on their government...
by NelsonCorp Wealth Management | Mar 12, 2020 | Chart of the Week
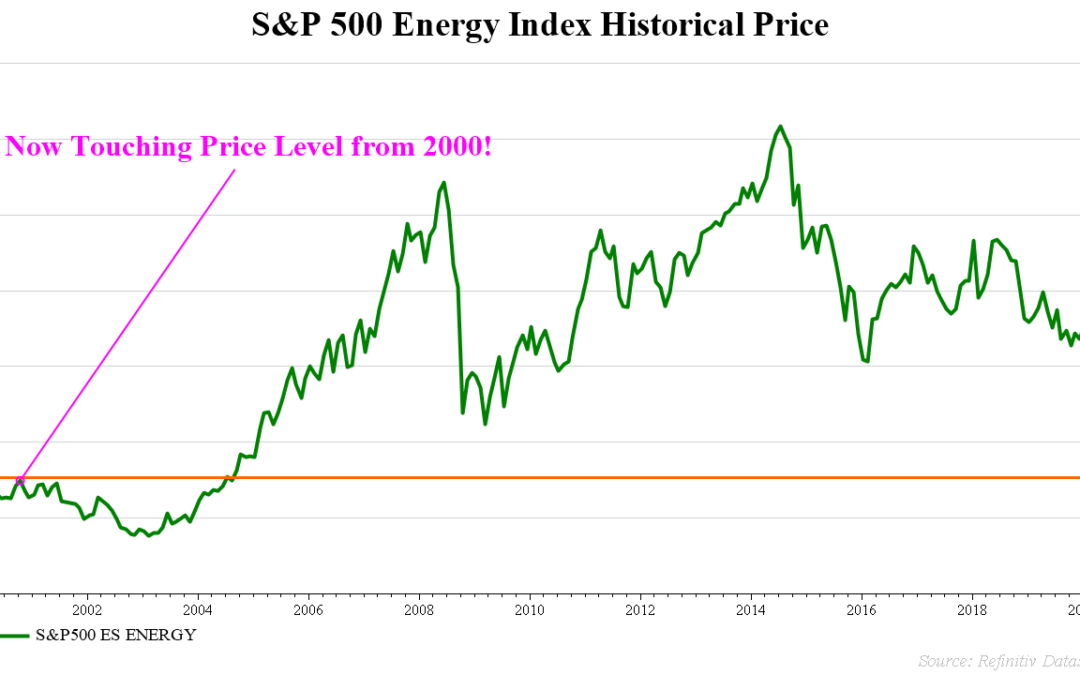
This week the energy sector of the S&P 500 stock index reached price levels last seen 20 years ago. These are not little companies, but big, blue chip, household names that have fallen, in some cases, 90% from their peaks! They are a cautionary tale that...
by NelsonCorp Wealth Management | Sep 19, 2019 | Chart of the Week
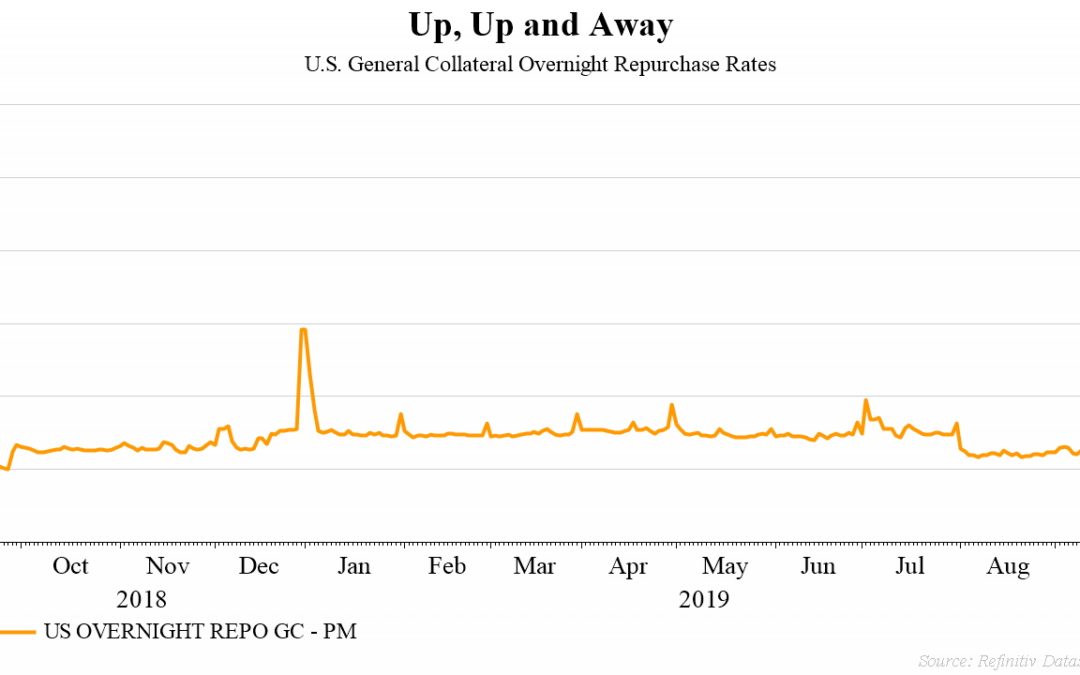
This week saw turmoil in an area of the financial markets that doesn’t get that much attention. On Tuesday, an overnight lending interest rate jumped to around 7% (it actually reached nearly 10% during the trading day) from its prior level of about 2.5%. These...
