
by NelsonCorp Wealth Management | Aug 17, 2023 | Indicator Insights
This week’s indicator is called the Global Recession Probability Model. It uses a statistical technique called “logistic regression” to identify when global economic growth might slow down, with the probability ranging from 0% to 100%. We talked about this...
by NelsonCorp Wealth Management | Aug 10, 2023 | Indicator Insights
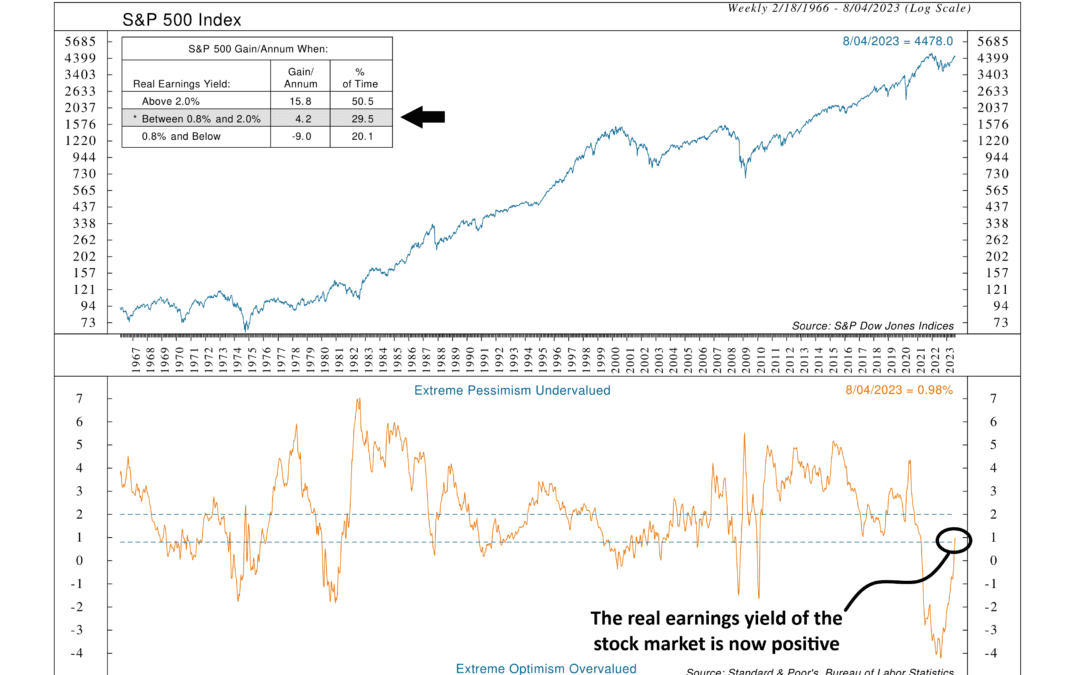
Last April, we talked about the real earnings yield indicator and how a continued fall in inflation could eventually bring the indicator into positive (bullish) territory. This week I want to give an update on how things are going. But first, here’s a quick...
by NelsonCorp Wealth Management | Aug 3, 2023 | Indicator Insights
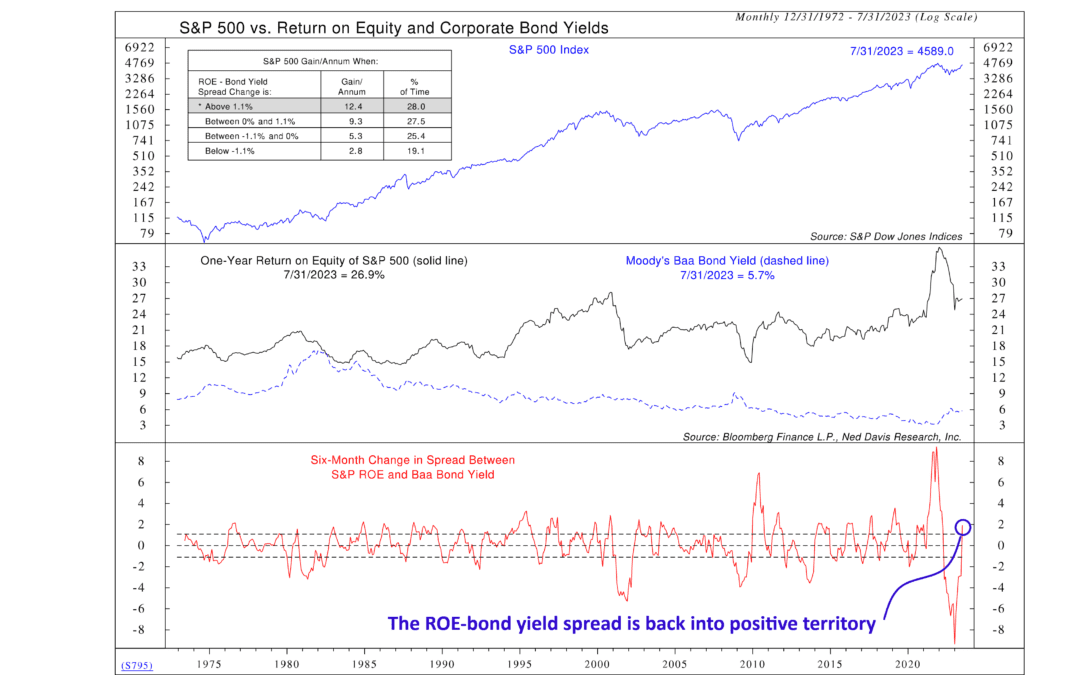
Last year on this blog, we highlighted how a surge in interest rates had led to an environment in which stocks were poorly valued based on profitability measures like Return on Equity (ROE), which measures how much a company earns for each dollar of equity...
by NelsonCorp Wealth Management | Jul 27, 2023 | Indicator Insights
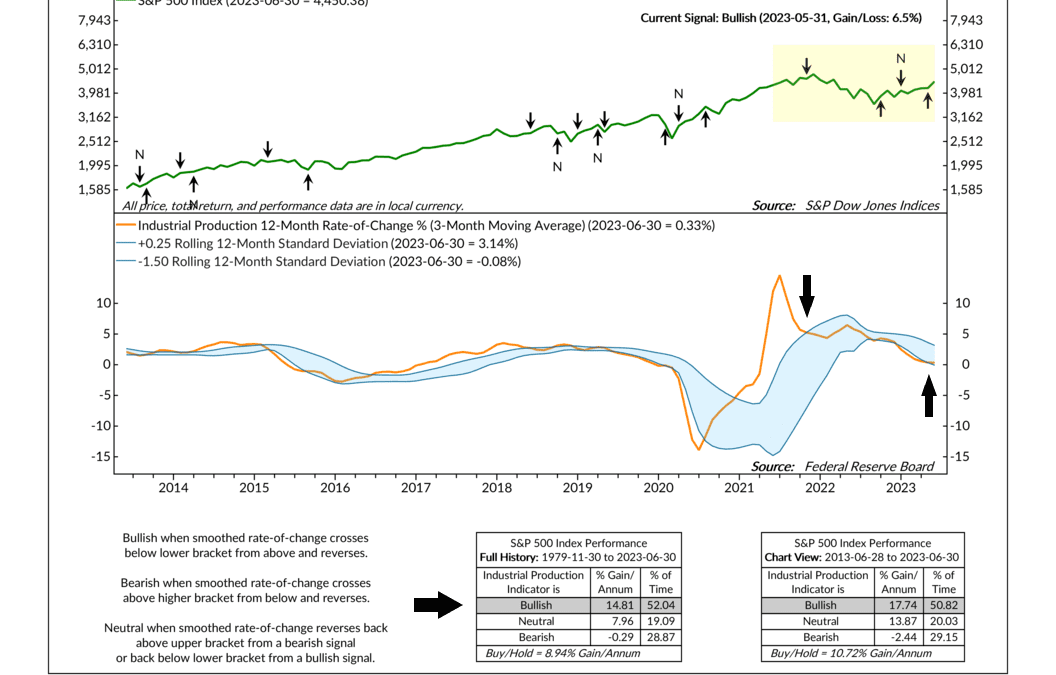
Industrial production is one of those unglamorous economic statistics that not many people think about on a regular basis. But it is an important statistic nonetheless, as it measures how much physical “stuff” we are producing in vital economic sectors like...
by NelsonCorp Wealth Management | Jul 20, 2023 | Indicator Insights
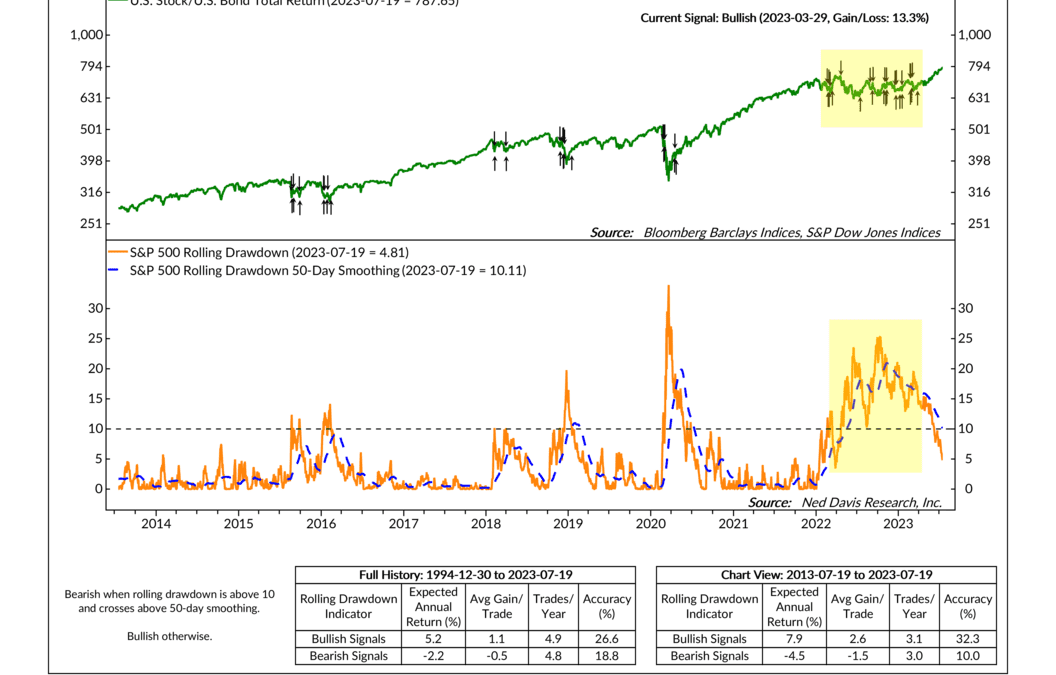
This week’s featured indicator highlights a concept known as the stock market’s rolling drawdown. The rolling drawdown—or trailing loss—is a measure used to assess the maximum loss an investment has experienced over time. In this case, we’re looking at the...
by NelsonCorp Wealth Management | Jul 13, 2023 | Indicator Insights
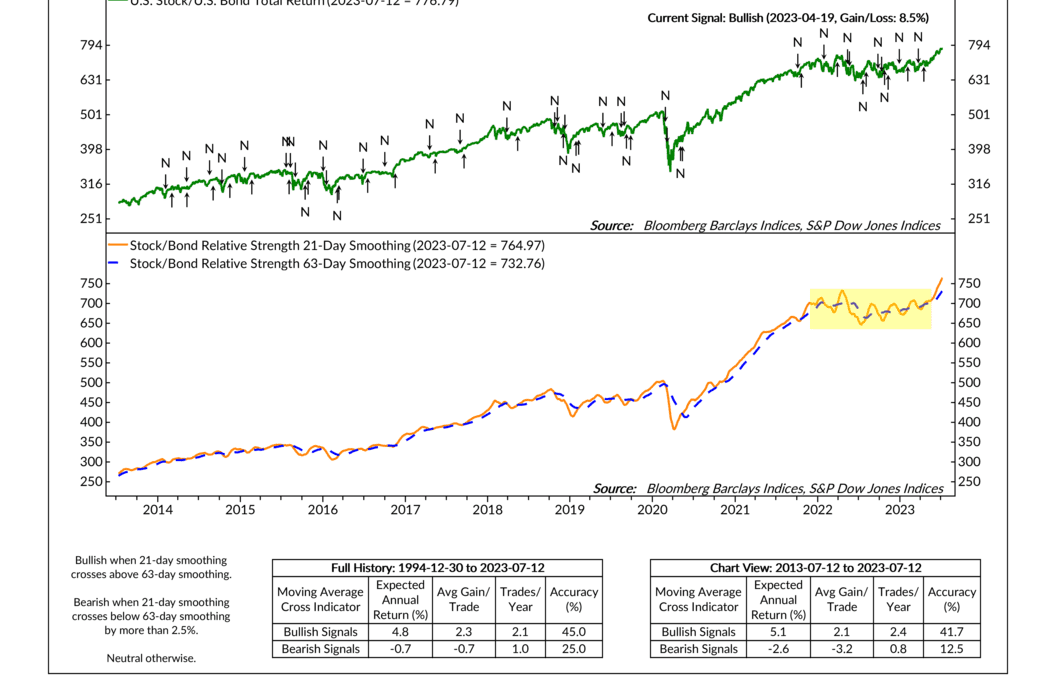
This week I want to introduce a technical indicator called a moving average cross. The basic idea is that you take two moving averages—one shorter-term and the other longer-term—and generate buy/sell signals for an asset based on whether the shorter-term moving...
