
by NelsonCorp Wealth Management | Sep 28, 2023 | Indicator Insights
July 28th, 2023. That was the day the S&P 500 index reached its highest level of the year (so far). Since then, the market has tumbled. As of this writing, the S&P 500 index is down roughly 7% from its summer high. After two months of a down market,...

by NelsonCorp Wealth Management | Sep 21, 2023 | Indicator Insights
Short-term rates are on fire. The 2-year Treasury rate—a rough proxy for where the market thinks the Fed is headed with interest rates—rose to its highest level in 17 years this week. This is significant because sharp increases in short-term interest rates have...

by NelsonCorp Wealth Management | Sep 14, 2023 | Indicator Insights
They say valuation—like beauty—is in the eye of the beholder. But we can still objectively value the stock market by comparing it to another asset, and that’s the goal of this week’s featured indicator. Specifically, the indicator compares stocks to a safe...
by NelsonCorp Wealth Management | Sep 7, 2023 | Indicator Insights
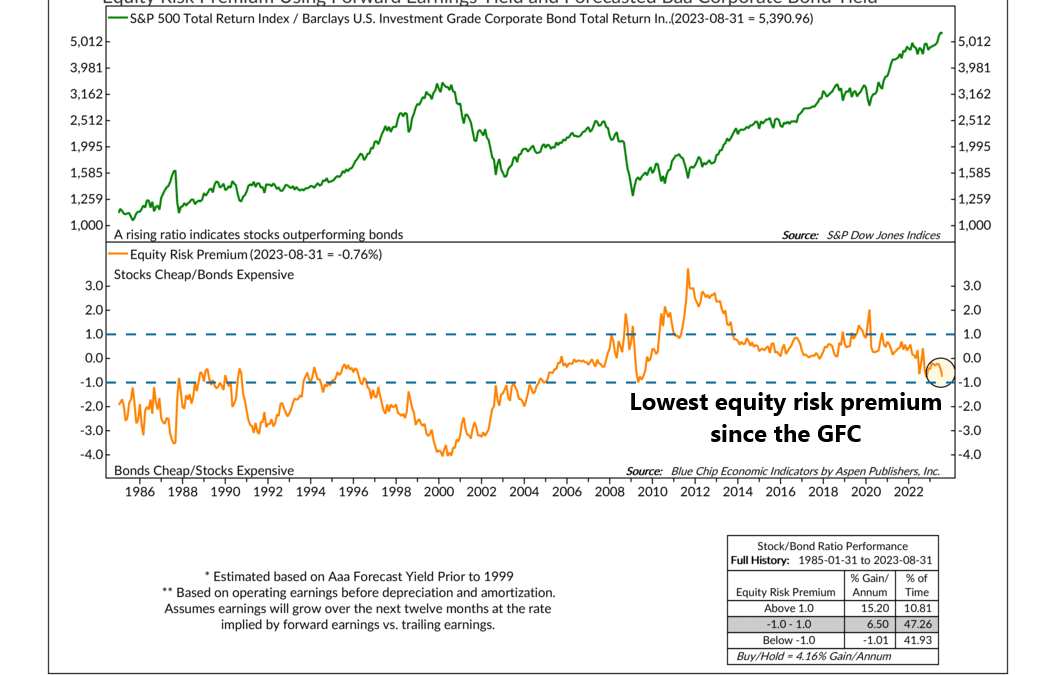
The equity risk premium is something that has been talked a lot about recently in the financial world, mainly because it dropped to its lowest level in 14 years last month. This is concerning because it has the potential to pose a significant challenge to the...
by NelsonCorp Wealth Management | Aug 31, 2023 | Indicator Insights
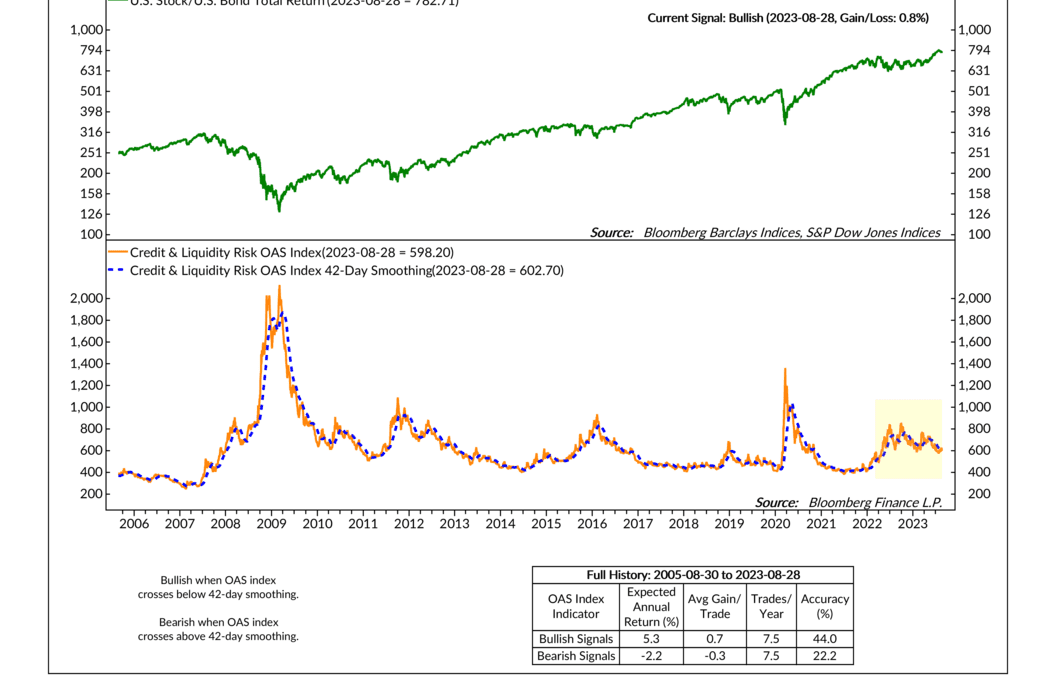
This week’s indicator features the Credit & Liquidity Risk OAS Index (orange line, bottom clip), which is an index that packages credit spread risk into one neat little metric. It rises when credit spreads widen and falls when credit spreads narrow. But...

by NelsonCorp Wealth Management | Aug 24, 2023 | Indicator Insights
This week’s indicator focuses on interest rates—and why rapid changes in interest rates can negatively affect the stock market. When we talk about interest rates in the financial world, we often reference the 10-year Treasury rate, the rate at which the federal...
