by NelsonCorp | Mar 12, 2026 | Indicator Insights
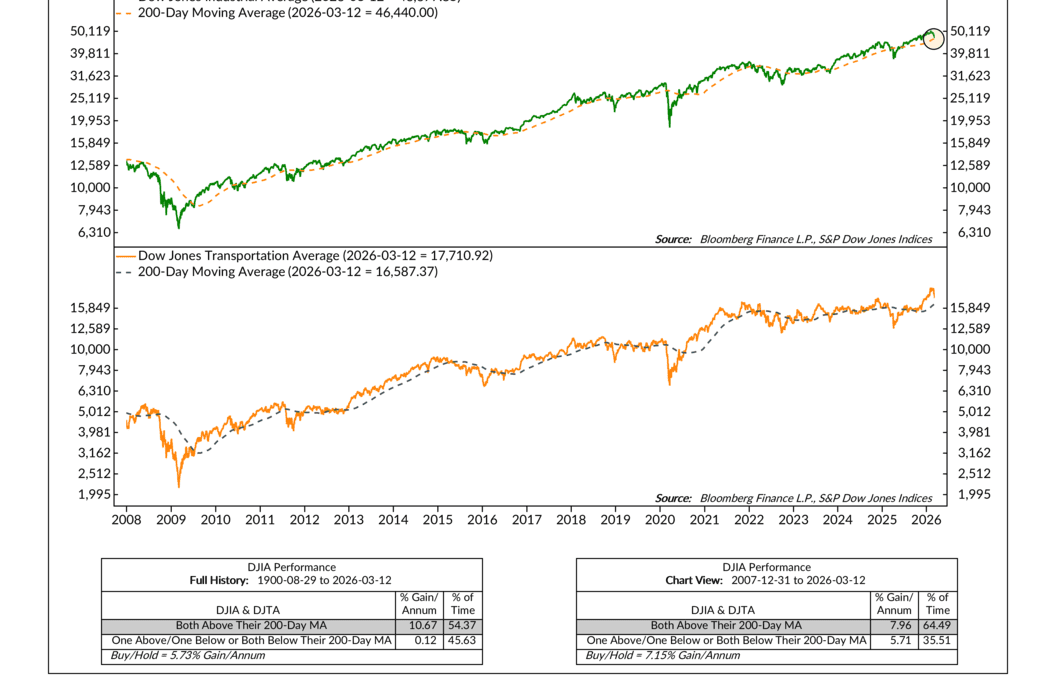
Sometimes good investing comes down to spotting clues. And like a good detective, the most important clues are often not what something is doing, but what it isn’t doing. That’s the idea behind this week’s indicator. In technical terms it’s called divergence,...
by NelsonCorp | Mar 5, 2026 | Indicator Insights
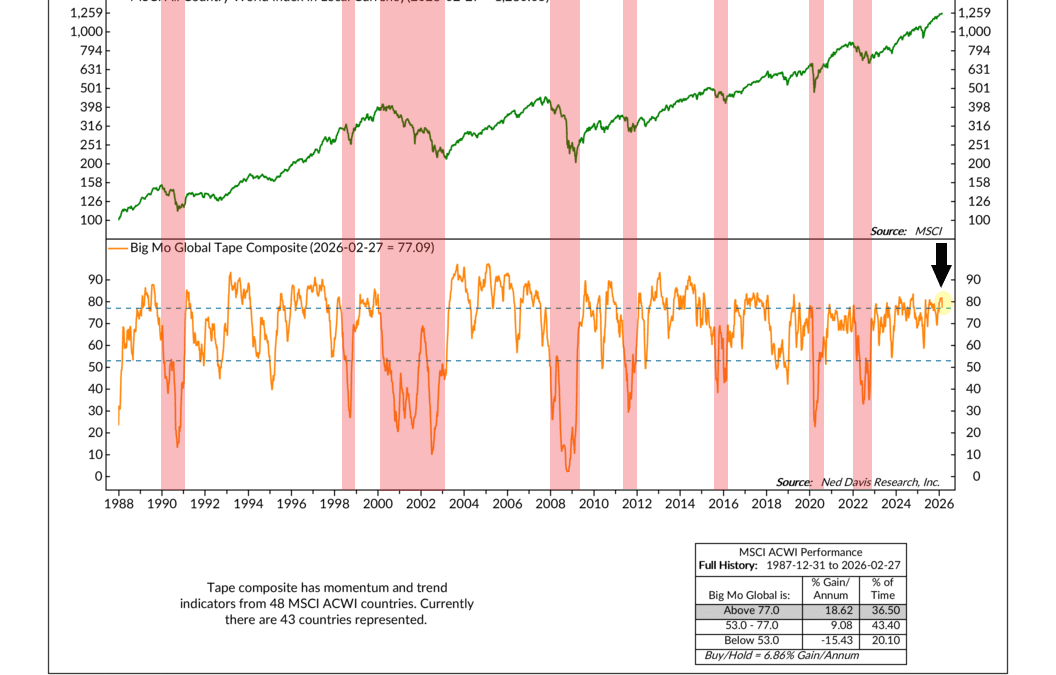
We often focus on the major stock indexes when trying to understand how the markets are doing. Take the MSCI All Country World Index, for example. It tracks stocks across both developed and emerging markets, producing a pretty good snapshot of global equity...
by NelsonCorp | Feb 26, 2026 | Indicator Insights
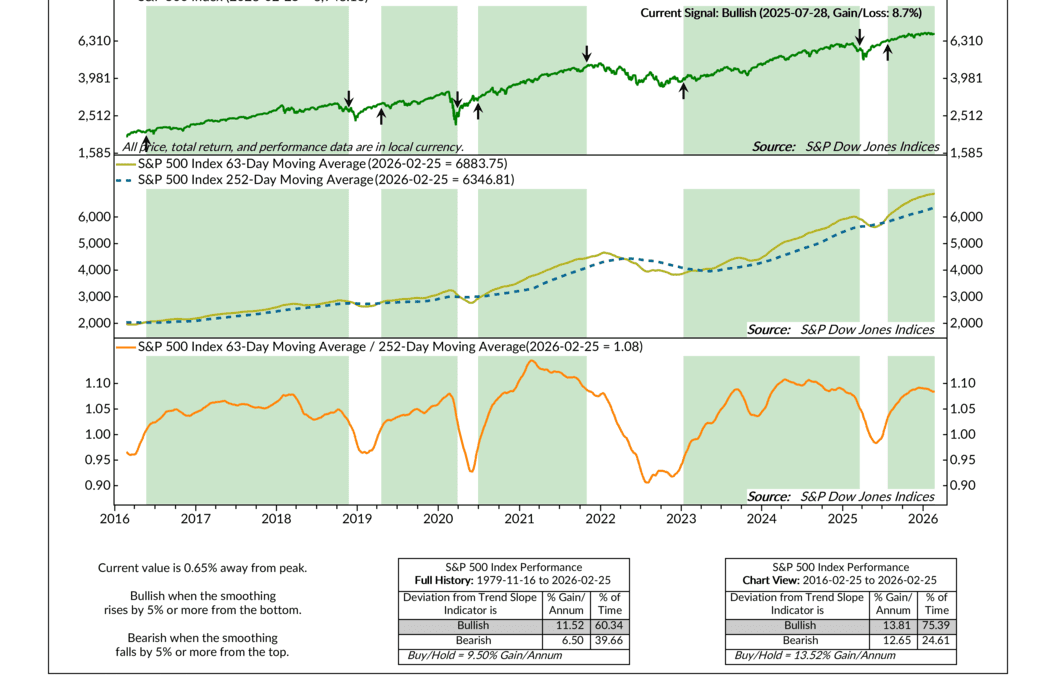
There’s a saying on Wall Street that says you should always “keep the trend your friend.” What is generally meant by that is whatever the market is doing from a price standpoint, you should probably try and follow along with it. In other words, don’t fight it....

by NelsonCorp | Feb 19, 2026 | Indicator Insights
Liquidity is one of those market words that gets thrown around a lot. But what does it actually mean? At its core, liquidity is simply how much money is sloshing around in the financial system. When liquidity is plentiful, there is more capital available to...
by NelsonCorp | Feb 12, 2026 | Indicator Insights
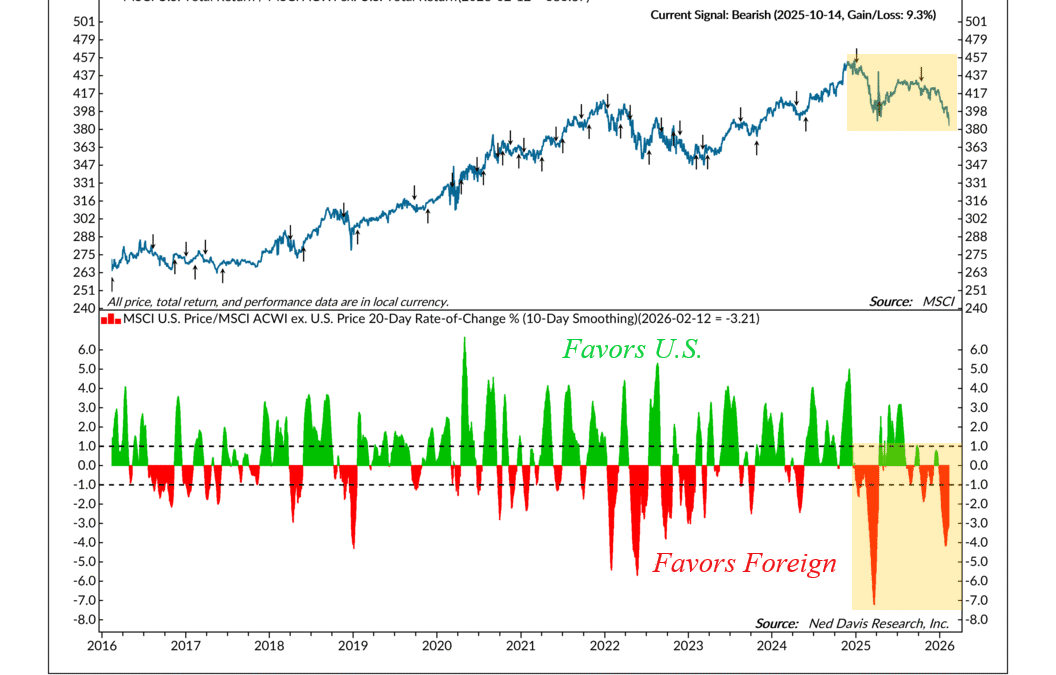
I like to call this week’s featured indicator the “Stay Home or Go Global” indicator. This is because it measures the relative strength of the U.S. stock market versus the global stock market. Here’s the basic idea. The top portion of the chart shows the ratio...
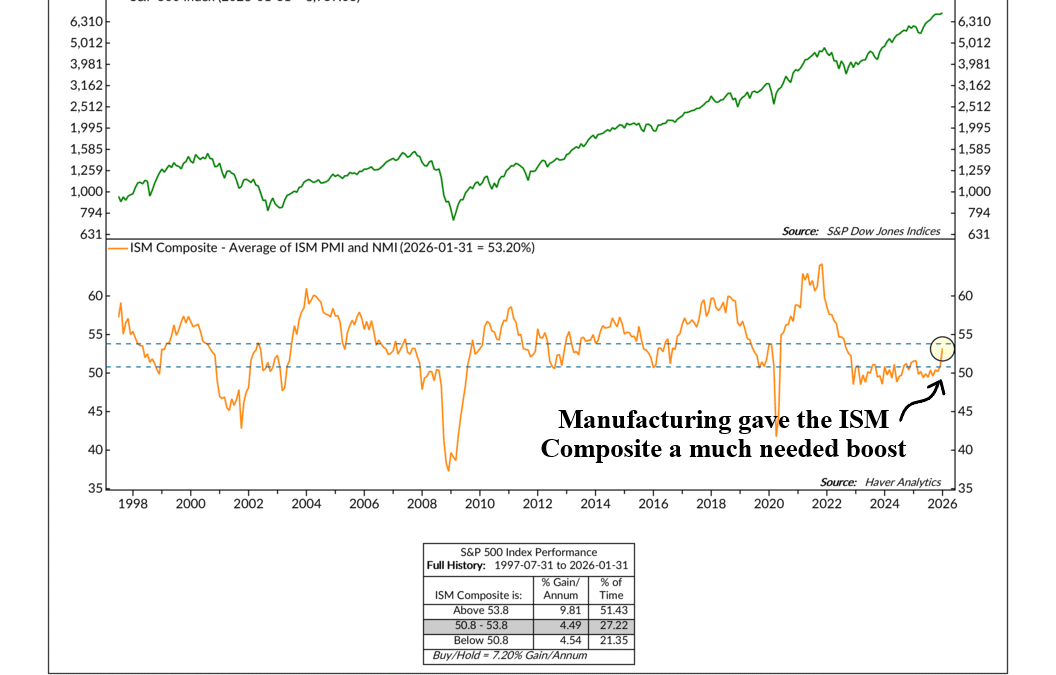
by NelsonCorp | Feb 5, 2026 | Indicator Insights
The good news on Wall Street this week came from a place that has been stuck in the mud for a while: manufacturing. The latest Institute for Supply Management Manufacturing index jumped to 52.6, up from 47.9 previously. This was significant for a couple of...