
by NelsonCorp Wealth Management | Mar 18, 2021 | Indicator Insights
Volatility, in plain terms, is a measure of how much prices move up and down over a given period. But there are many ways to measure volatility. For our featured indicator this week, we evaluate it using something called an Absolute Breadth Index. The...
by NelsonCorp Wealth Management | Mar 11, 2021 | Indicator Insights
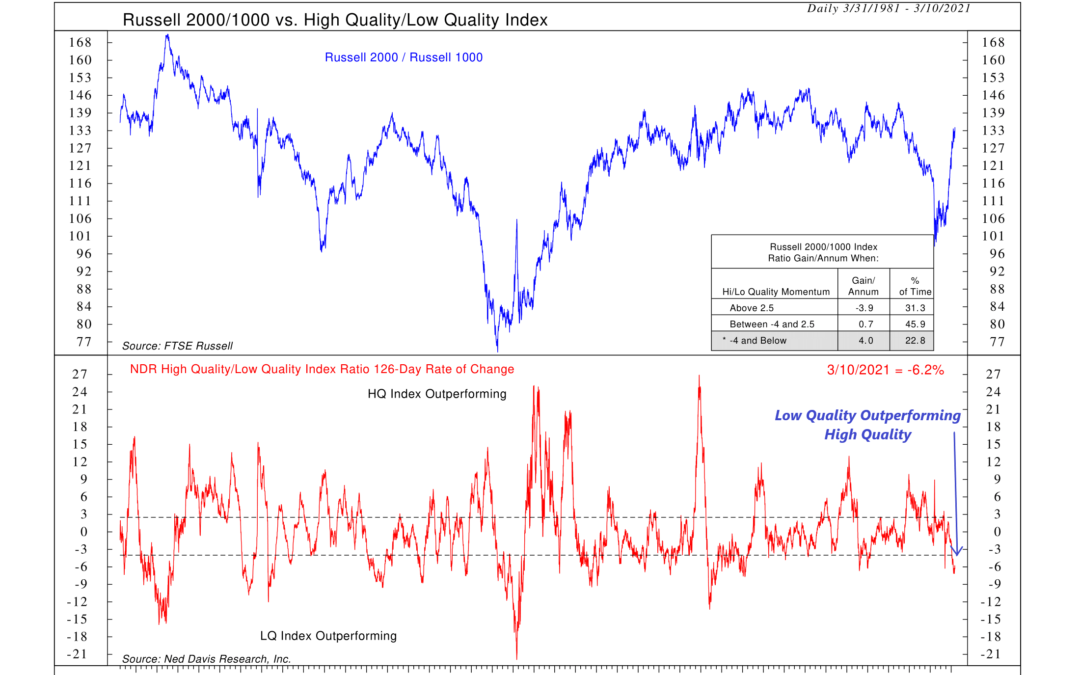
This week’s featured indicator focuses on the High Quality/Low Quality Index. This is what we call a “relative strength” indicator because it takes the performance of one stock index and divides it by another to get a relative strength line. When the line is...
by NelsonCorp Wealth Management | Mar 4, 2021 | Indicator Insights
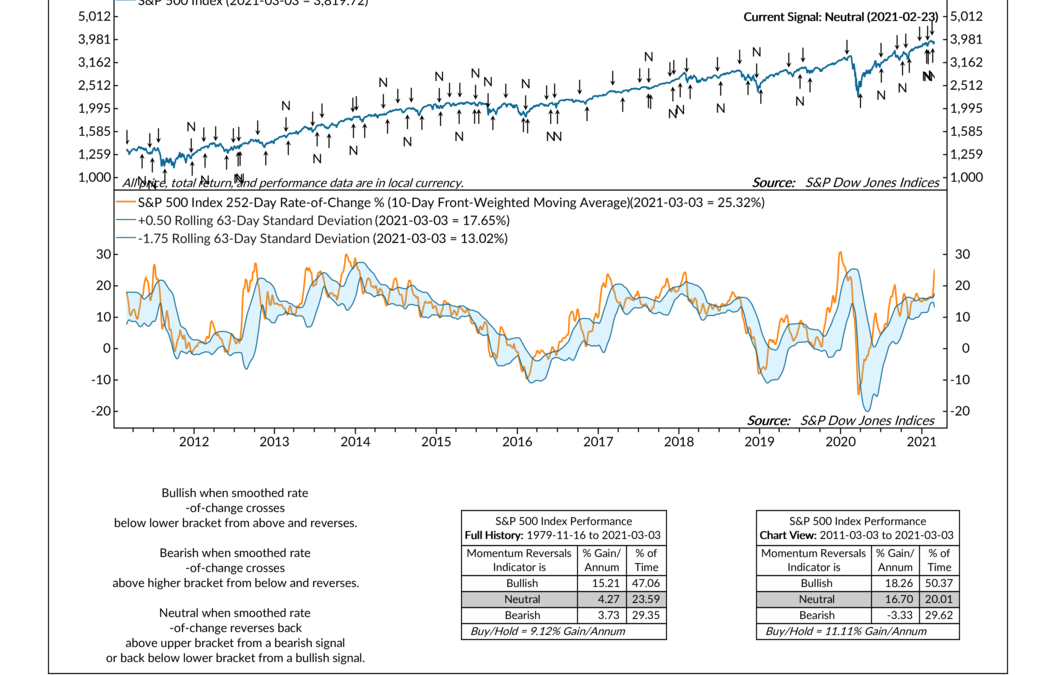
Imagine you throw a ball into the air. What happens? The ball keeps rising for a while—due to its momentum—and then it tumbles back to earth as gravity takes over. This is the basic concept of this week’s featured indicator: Momentum Reversals. Momentum is...
by NelsonCorp Wealth Management | Feb 25, 2021 | Indicator Insights
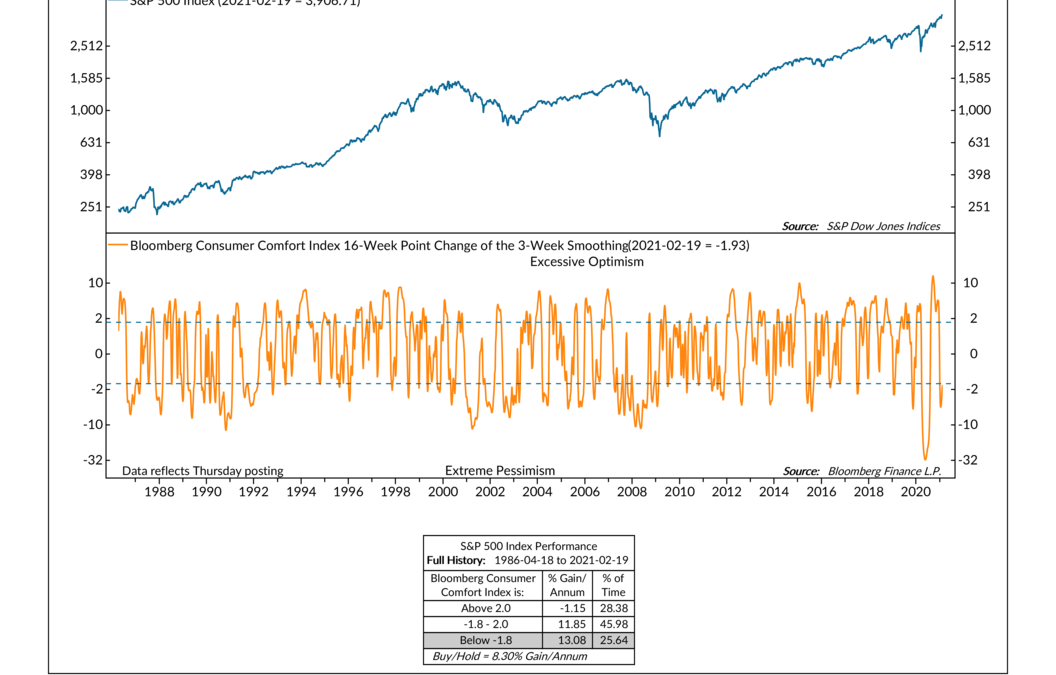
Confidence is key when it comes to investing. However, like a skier who has leaned too far out over her skis, confidence can backfire when it becomes excessive. When everyone is overly optimistic at the same time, trades become crowded, and returns tend to...
by NelsonCorp Wealth Management | Feb 18, 2021 | Indicator Insights
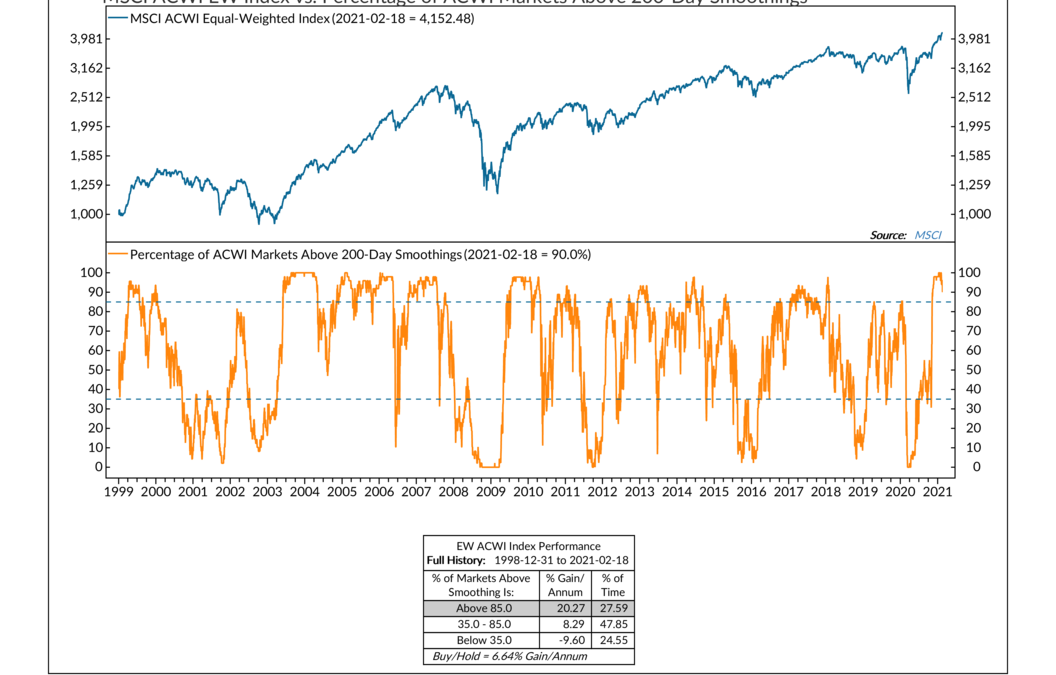
This week’s featured indicator looks at global stock participation. We tend to focus heavily on U.S. stocks a lot of the time. But if the rest of the world is bullish on stocks, it means risk appetites, in general, are high. This tends to be a good...
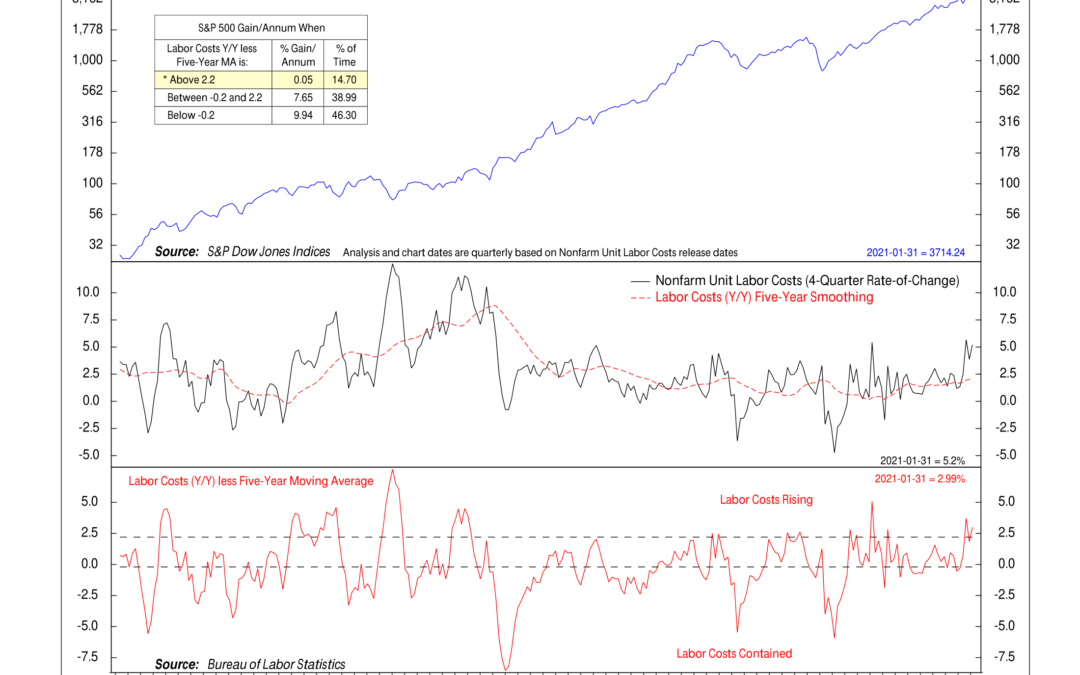
by NelsonCorp Wealth Management | Feb 11, 2021 | Indicator Insights
This week’s featured indicator looks at nonfarm unit labor costs. Unit labor costs measure how much a business pays its workers to produce one unit of output. To find it, we take the total compensation of workers, including wages and benefits (such as health...